
Why Test Scores Are Dropping in Developed Countries: Demographics, Not AI
Woke intellectuals will tell you what you want to hear: worse teachers, cell phones, COVID, and AI; these have modest impacts compared to the real-time human capital shift.

This doesn’t surprise me at all… and it shouldn’t surprise anyone with a functioning brain who understands evolutionary trait distributions and isn’t fully brainwashed by Blank Slate anti-hereditarian shell games.
If you are a “woke intellectual” it will shock you… and you’ll start thinking things like:
Teacher quality is getting worse!
COVID really set these kids back!
Cell phones are clearly the cause!
Kids are losing critical thinking skills cuz of AI!
Schools aren’t getting enough funding!
Teacher quality has taken a hit due to prioritization of DEI… but it’s mostly irrelevant as a cause of declining test scores. If you are working with students that have lower genetic intellectual potential, it’s probably better if you have them playing sports or getting exercise most of the day and then doing some sort of disciplined zero-cell-phone learning for low performers when they are too burnt out to “act out.” You’d be better with some sort of gym class + babysitter combo… then learning when they are willing to focus.
COVID did set some kids back for a bit… but most rebounded. It did not do permanent damage. It was an accelerant toward everything “digital” and “online classes” wherein kids are checking IG, TikTok, Facebook, Snapchat, etc. and distracted by things on the internet while trying to learn.
New research suggests the “computer for every child” was an epic fail. Test scores got worse as a result of giving kids technology. Once again this is a genetic capacity (substrate) issue… need to biologically upgrade IQ in most kids or things like guaranteed computers won’t do much. Computers in many low performers may have exacerbated distraction/ADHD-like manifestations.
Kids are losing critical thinking skills from AI? Maybe. Some are, others aren’t. I’d say the lower quintile probably. The upper quintile maybe too but not as much. Some critical thinking skills training might help, but training only works if the students have the capability of absorbing what you’re teaching (many do not).
Schools aren’t getting enough funding is the most moronic take possible. Schools are massively overfunded and excess funding yields little to no improvement (the ROI is egregiously negative). The most funded schools are merely a correlation with high IQ kids who get schools well-funded from high-IQ parents — and “good teachers” as a result. We see when we try to “diversity” the top schools with other kids, scores tank and wokes wonder: What went wrong? What’s causing the decline here? (Common sense? Zero.)
As I’ve said, I could get the same or better results in low performing school districts by letting the kids play sports or do some sort of exercise for half the day and then when they’ve burnt off all the aggression/energy, they can focus on basic skills: reading, writing, math — without any electronics.

Why Test Scores Are Really Falling
A viral chart “Average Scores on Intelligence Assessments in High-Income Countries” from ProfGMedia’s writeup: “Is AI Making Us Dumb?” — sparked a lot of debate on X (Twitter) over the causes of widespread declines in academic performance in teens and adults.
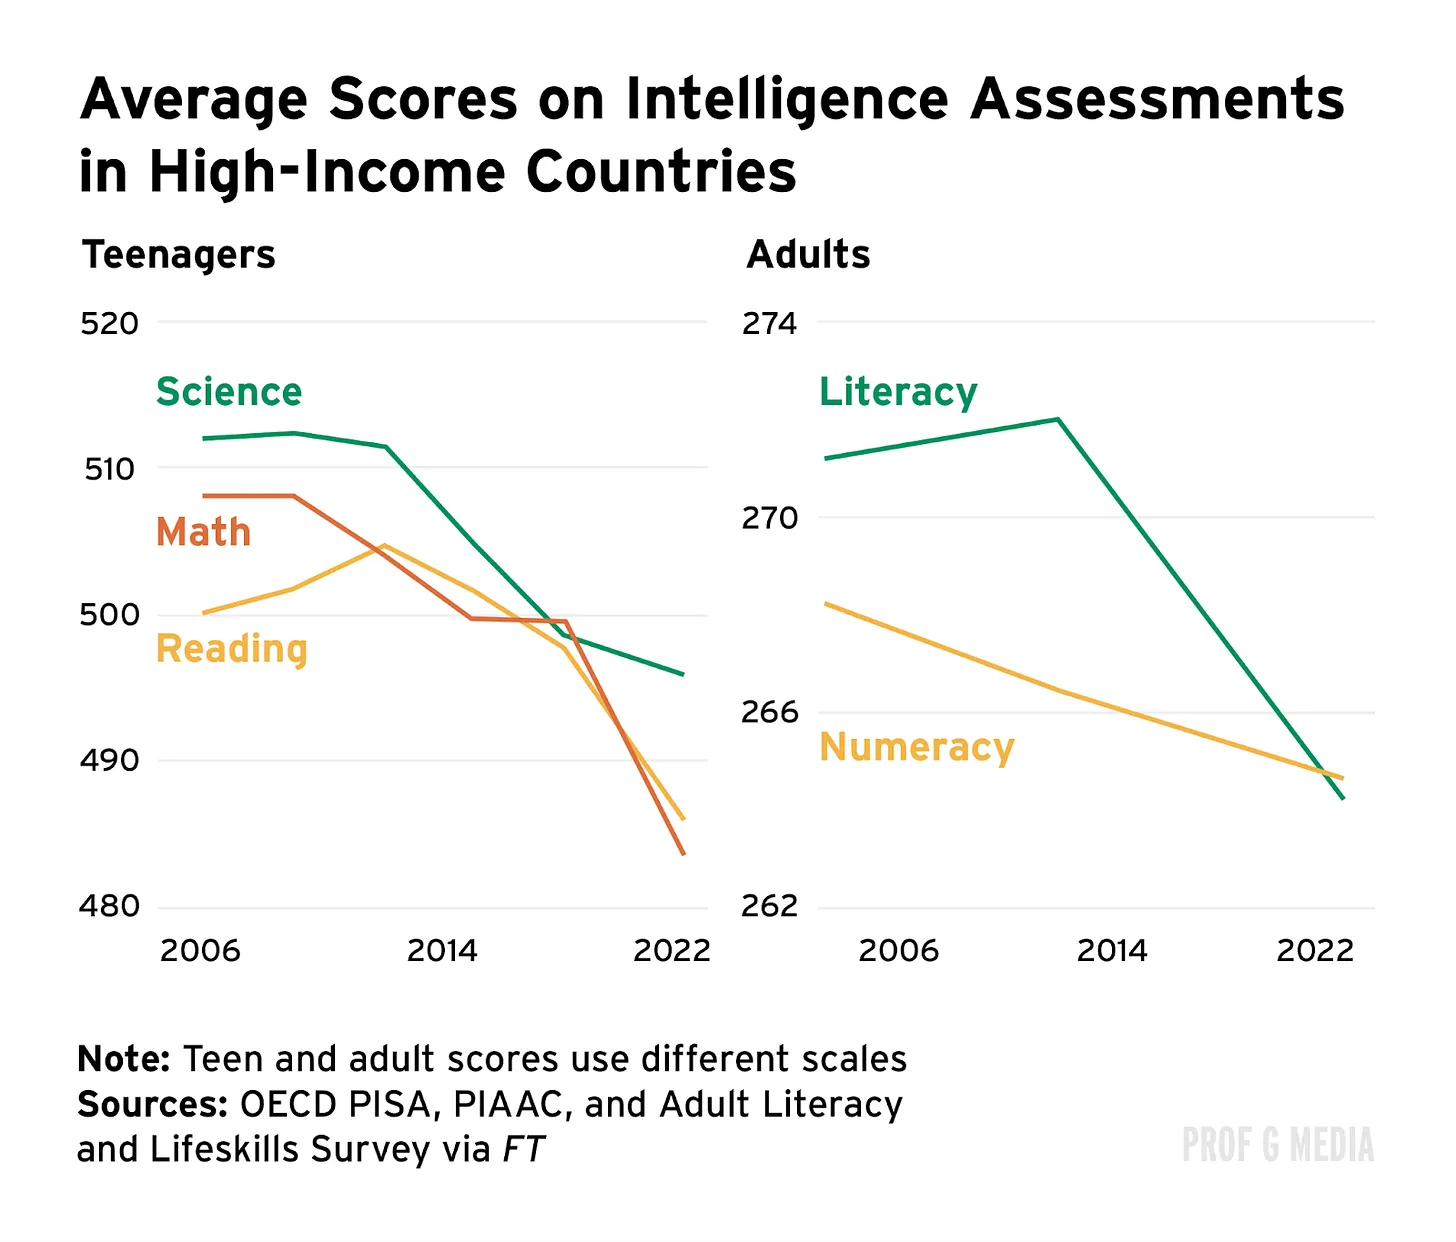
The chart shows every line falling: teen math, reading, and science from 2006–2022, and adult literacy and numeracy cratering from 2014–2022. Scott Galloway’s team uses this to argue that AI and smartphones are rotting our brains through cognitive offloading and attention degradation. “The cost of AI is your own intelligence,” they conclude.
They’re 100% wrong about the primary driver.
Not because smartphones and AI offloading aren’t real (they are), but because they’re treating a symptom as the disease.
The underlying data is brutal.
The OECD’s PISA 2022 results show the OECD math average falling a record 15 points (489→472) between 2018 and 2022 — triple any previous decline. Reading dropped 10 points, double the prior record.
The PIAAC 2023 results for adults are worse: US literacy fell 12 points from 2017 to 2023, with 28% of adults now at Level 1 or below — functionally unable to use a library search engine.
And critically, the adult data reflects the same demographic shift that’s driving the teen decline.
The adults being tested in PIAAC 2023 are a completely different demographic mix than those tested in 2012.
The White share of the 16–65 working-age population has fallen substantially over the decade.
Older White adults in the sample are now past peak cognitive function (fluid IQ peaks in mid-20s and declines steadily after 50), while the younger adults entering the sample are the most demographically diverse cohort in US history — majority-minority among under-18s since 2020.
You’re measuring an aging, cognitively declining White population mixed with an expanding, younger, lower-mean-scoring non-White population and calling the result “AI made us dumb.” No. The people taking the test changed.
Finland, the global education darling, collapsed 64 points in math from its 2006 peak (548→484). Germany dropped 39 points. Norway fell 33 in a single cycle. The Netherlands shed 26.
Conventional explanations: COVID learning loss, smartphones, TikTok brain, bad teachers, AI offloading, insufficient funding — are not entirely wrong but they are secondary.
They are the explanations you’re allowed to say out loud. They’re what intellectuals and policymakers love because they’re socially acceptable, imply fixable problems, and keep the grant money flowing.
What’s the real driver? The one nobody wants to name because you’ll be smeared as an Evil Eugenicist and out of a job faster than you can blink.
The primary driver of declining test scores across the developed world is demographic composition change — the replacement of higher-scoring populations with lower-scoring ones through unselected immigration and differential fertility.
The secondary driver is dysgenic fertility for IQ within all groups; the least cognitively adept are having the most children.
The tertiary drivers and accelerants (e.g. cell phones, COVID, teacher quality erosion) are real but compound the structural deterioration rather than causing it.
The evidence for this is overwhelming, and I’m going to lay it out.

The Natural Experiment: Homogeneous Countries vs. Diversifying Countries
If demographics are the primary driver, there’s a clear prediction: countries that remained demographically homogeneous should have held their scores, while countries undergoing rapid demographic change should have crashed.
That’s exactly what happened.
Japan — 98.1% ethnically Japanese, near-zero immigration. Math scores (source): 523 (2006) → 536 (2012) → 527 (2018) → 536 (2022). Gained 13 points over the period while the OECD average fell. 2022 results “among the highest ever measured by PISA” in math and science. 88% reached at least Level 2 proficiency vs. 69% OECD-wide.
Singapore — ethnically diverse (Chinese 74%, Malay 13%, Indian 9%) but with an aggressively selective immigration system that filters on cognitive ability. Math: ~562 (2009) → 573 (2012) → 569 (2018) → 575 (2022). First place globally, gained 13 points, 41% of students at Level 5+. Singapore is “one of the very few countries in PISA that show consistent improvement over time.” Not homogeneous by ethnicity — but homogeneous in cognitive selection. Singapore proves the thesis isn’t about race per se, it’s about who you let in.
Chinese Taipei (Taiwan) — 95%+ Han Chinese, minimal immigration. Math: 549 (2006) → 560 (2012) → 531 (2018) → 547 (2022). Essentially flat over 16 years. Gained 16 points from 2018 to 2022 — one of only four systems globally that improved in all three subjects. 2022 results “among the highest ever measured by PISA in reading and science.” 32% of students at Level 5+.
Macao (China) — ~88% ethnically Chinese, minimal immigration. One of only four systems globally that improved in all three subjects across their entire PISA participation. Math: 552 (2022), ranked 2nd globally behind Singapore. The OECD notes Macao is the only system that simultaneously increased its share of high-performing students (Level 5+) and reduced its share of low performers over the past decade. Most socio-economically disadvantaged students in Macao scored above the OECD average.
Hong Kong — ~92% ethnically Chinese, cognitively selected mainland immigration. Math: 547 (2006) → 561 (2012) → 551 (2018) → 540 (2022). Essentially stable (−7 over 16 years), still in the global top six. 27% of students at Level 5+.
Estonia — ~69% ethnic Estonian, ~25% Russian-speaking legacy minority (stable, not recent immigration), ~9% immigrant students. Math: 515 (2006) → 523 (2018) → 510 (2022). Essentially stable (−5 from 2006), ranked 1st in Europe and 6th globally — at roughly half the per-pupil spending of the US. Demographic stability preserved a world-class system.
Lithuania — ~86% ethnic Lithuanian, minimal recent immigration. Math: 486 (2006) → 479 (2012) → 481 (2018) → 475 (2022). The OECD describes the trajectory as “only small, and mostly non-significant fluctuations around the historic average” — essentially flat over 16 years. OECD designates Lithuania as one of four “resilient” education systems alongside Japan, Korea, and Taiwan.
South Korea — homogeneous, minimal immigration. Math: 554 (2012) → 527 (2022). A 27-point decline from peak — the only significant drop among the homogeneous/selective group, plausibly driven by extreme gaming culture, smartphone addiction, and academic burnout. But note: Korea still ranks in the global top six and is OECD-designated “resilient.” Even the worst-performing homogeneous country outperforms the diversifying West by a wide margin.
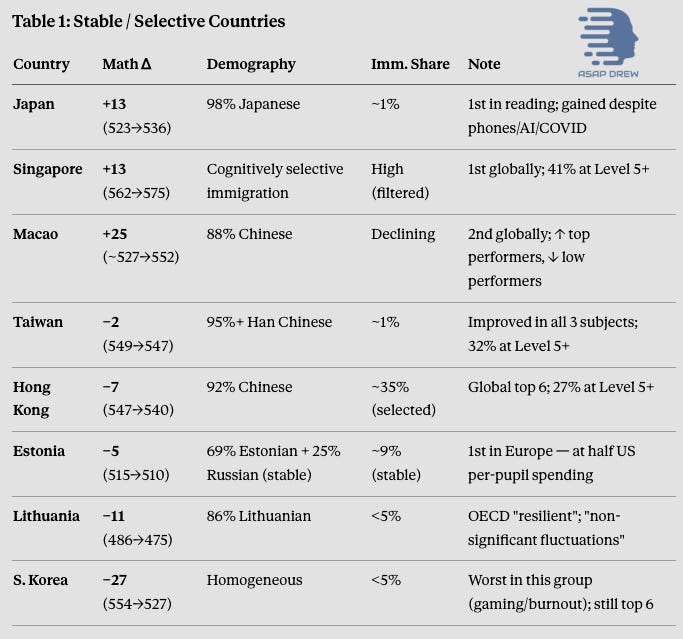
That’s eight highly developed, demographically stable or selectively-immigrating systems — and all of them either gained or held roughly steady while the OECD average cratered a record 15 points.
They have: smartphones, TikTok, AI… and they also had to deal with COVID.
The one variable they don’t share with the West is mass unselected immigration from lower-scoring populations.
Every time PISA results drop, the think-tank industrial complex produces the same article: “What can we learn from Japan, Singapore, Estonia?”
The answer is always the same: better teacher training, more rigorous curricula, higher expectations, blah blah blah.
Nobody ever asks the obvious question: what if the methods cannot really be replicated because you lack the DNA?
Japan didn’t gain 13 points because it discovered a pedagogical secret. It gained because it has the same 98% Japanese population it had in 2006, with the same cognitive distribution, the same parental investment culture, and the same genetic substrate — and it didn’t dilute any of that with unselected immigration.
Estonia doesn’t outperform Germany at half the spending because Estonian teachers are twice as good. It outperforms because its student body is 69% ethnic Estonian and 25% Russian (two high-performing populations), and that composition hasn’t changed. The variable isn’t the curriculum. It’s the DNA.
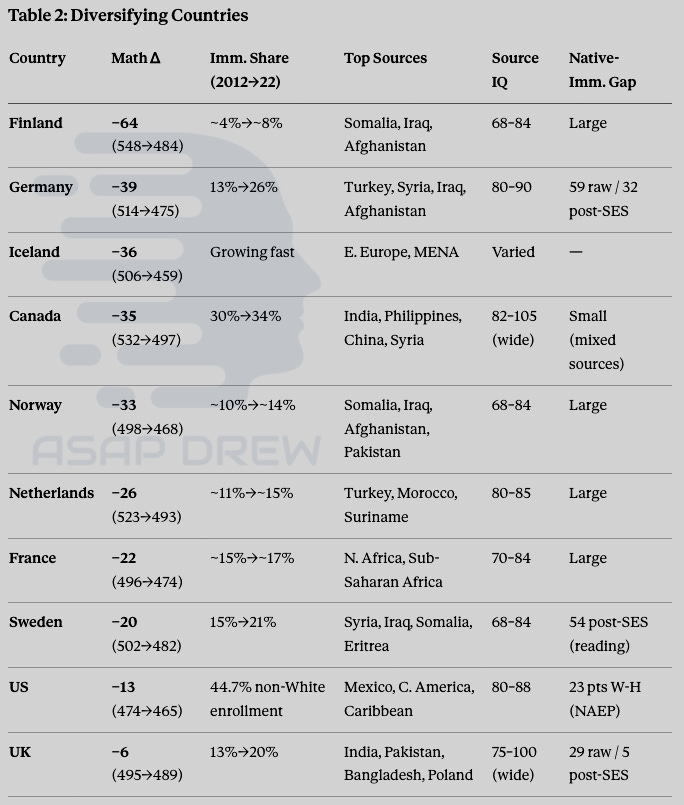
Now compare to the countries that diversified rapidly:
Note: Origin-country IQ estimates from Lynn & Vanhanen (2012), Wicherts et al. (2010), and Rindermann (2018). Ranges reflect measurement uncertainty and within-country variation. (National IQs are Valid)
Several critical details:
Germany — The immigrant student share doubled from 13% to 26% in one decade. The native-immigrant raw gap is 59 PISA points (32 points even after SES controls). The 1.1 million refugees received in 2015 came predominantly from Syria (mean IQ ~83), Iraq (~87), and Afghanistan (~84).
Sweden — Immigrant students rose from 15% to 21% of the PISA sample, with 11% first-generation (arrived recently). The top source countries between 2010 and 2020 were Syria, Afghanistan, Somalia, Eritrea, and Iraq. A devastating finding from Sweden’s own PIAAC data: migrants from the Arab states and Sub-Saharan Africa with high education levels (equivalent to a college degree) scored at the same numeracy level as low-education native Swedes — those with less than two years of secondary school. The genetic potential ceiling is different. Additionally, 76% of Sweden’s immigrant students don’t speak Swedish at home — the highest rate in the OECD. Average grades of migrant students from Africa are the lowest of any group and have declined markedly over time. Wikipedia’s article on immigration to Sweden directly notes that “this underperformance of immigrants in Swedish schools has been cited as a significant part of the reason why Sweden has dropped more than any other European country in the international PISA rankings.”
Finland — Smaller immigrant share than Germany or Sweden, but Finland’s decline is the steepest of any OECD country (−64 from peak). This suggests that even modest demographic shifts, combined with severe environmental factors (Finland adopted 1:1 device programs early), can produce enormous drops when compounded. Finland’s immigrant population is drawn primarily from Somalia, Iraq, and Afghanistan — the same origin-country profile as Sweden’s.
The United States — White public school enrollment fell from 61.2% (2000) to 44.7% (2022). Hispanic enrollment nearly doubled from 16.4% to 28.7%. Unlike European countries where immigration is the primary mechanism, the US demographic shift is driven by both immigration and differential fertility within the existing population.
The United Kingdom — Immigrant students rose from 13% to 20% between 2012 and 2022, with 9% first-generation. The UK’s relatively modest math decline (−6) compared to Germany or Sweden is instructive: it reflects the composition of immigration, not just the amount. British immigration includes a substantial South Asian component — Indians, who have among the highest test performance of any immigrant group globally, alongside lower-performing groups from Pakistan, Bangladesh, Somalia, and the Caribbean. The native-immigrant math gap in the UK is just 29 points raw and only 5 points after SES and language controls — far smaller than Germany’s 59/32. This confirms the thesis: it’s not immigration per se, it’s who you immigrate. The UK’s science scores, however, have been in a confirmed decade-long decline since 2012, and the math scores came with an important asterisk — one in three schools refused to participate, meaning higher-performing pupils were likely overrepresented.
Canada — The supposed model of “selective immigration” that everyone loves to cite. Immigrant students now comprise 34% of Canada’s PISA sample (up from 30% in 2012), with 16% first-generation. Math: 532 (2003) → 497 (2022), a 35-point decline — steeper than Germany’s. The claim that “Canada’s points system selects for talent” obscures the reality: only 58% of Canada’s permanent residents arrive through the “economic” class, and that figure includes accompanying spouses and children who aren’t themselves selected on any cognitive criteria. Another 27% arrive through family reunification (completely unselected) and 15% as refugees and humanitarian cases. The actual principal applicant passing through skills-based selection is well under half of all immigrants. Top source countries — India, Philippines, China — have a wide IQ range (Indian immigrants to Canada skew toward higher-caste, educated subpopulations, but Filipino and Chinese immigrants increasingly include lower-skill family reunification cases). Manitoba has dropped 58 PISA points since 2003. Canada’s proportion of students at the lowest proficiency level increased by 7 percentage points in both math and reading since 2012. Canada is not a success story — it’s failing more slowly than Europe because it starts from a higher baseline and its immigrant mix includes a high-performing Indian/Chinese tail, but the overall trajectory is firmly downward.
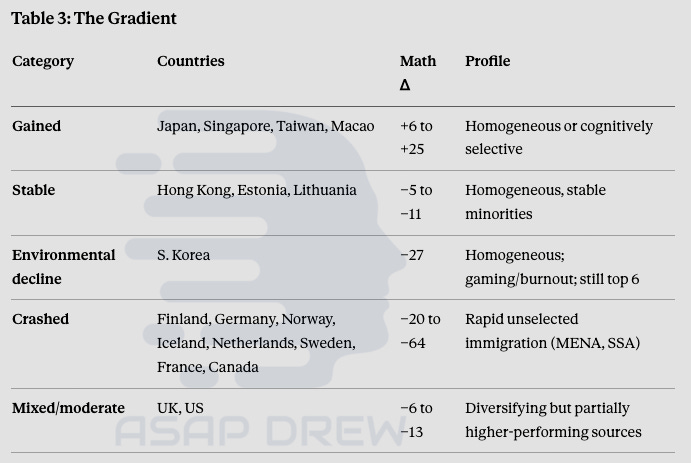
The correlation is clear:
The more unselected immigration a country received from source countries with lower mean cognitive scores, the steeper its PISA decline.
Countries that maintained demographic stability (or, like Singapore, imported selectively): held or gained in scores.
The UK’s moderate decline despite heavy immigration, driven by a partially high-performing Indian immigrant stream, confirms the mechanism: it’s not immigration volume, it’s origin-country cognitive profile.
Canada, everyone’s favorite “selective” immigration model, dropped 35 points — worse than Germany, because its selection is weaker than advertised and the volume is enormous (34% immigrant students).
This is not coincidence across 18 countries on three continents. It’s the primary signal in the data.
Phones and COVID cannot explain this gradient… only demographics can.

The US: Arithmetic That Nobody Wants to Do

The compositional math in the US is straightforward.
Non-Hispanic White share of US population (Census Bureau): 69.1% (2000) → 63.7% (2010) → 57.8% (2020). The White population actually declined in absolute numbers between 2010 and 2020 — the first time in US history. White median age: 43.7. They’re aging out and dying faster than reproducing.
Hispanic share: 12.5% (2000) → 16.3% (2010) → 18.7% (2020). Over half of all US population growth from 2010–2020 came from the Hispanic population. Hispanic median age: 29.8.
In public school enrollment (NCES), the shift is even more dramatic. White students dropped from 61.2% (2000) to 44.7% (2022) — now a minority of the student body. Hispanic students nearly doubled from 16.4% to 28.7%.
Now look at NAEP scores by race. 8th grade math, 2022: White ~275, Hispanic ~257, Black ~244, Asian ~295. The White-Black gap is approximately 31 points (~0.86 SD). The White-Hispanic gap is approximately 23 points (~0.64 SD). These gaps map directly onto the psychometric literature: the Roth et al. (2001) meta-analysis of 6.25 million test-takers found a Black-White gap of 1.1 SD and a Hispanic-White gap of 0.72 SD on cognitive tests. The WAIS-IV standardization data shows a White-Hispanic gap of ~12 IQ points and a White-Black gap of ~15 IQ points.
The arithmetic: Replace 16.5 percentage points of the student testing pool from a group averaging ~275 (White) with a group averaging ~257 (Hispanic). That’s a 23-point scoring difference applied to a 12%+ compositional swing. Mechanical effect: approximately 3–4 NAEP points downward. Add the rising English Learner share, the growing “Two or More Races” category, and within-group compositional shifts (more recent immigrants within the Hispanic category), and the total compositional effect plausibly accounts for 4–6 of the ~9-point national 8th grade math decline from 2013–2022 — roughly half.
Tom Loveless documented the mechanism precisely: from 2009 to 2019, national 4th grade NAEP math was flat (240 → 241), yet Hispanics, Blacks, and Asians all gained within their groups. The national score stagnated because the growing share of lower-scoring groups offset the within-group improvements.
This is Simpson’s Paradox in action; the aggregate hides the compositional shift. The same phenomenon, now accelerated, is driving the post-2013 decline.
Unselected Immigration: Nobody’s System Actually Selects
The standard narrative contrasts “selective” systems (Canada, Australia) with “unselected” systems (US, Europe). This is misleading. Almost no Western country actually selects the majority of its immigrants on cognitive ability. The question is what fraction slips through without any selection — and from where.
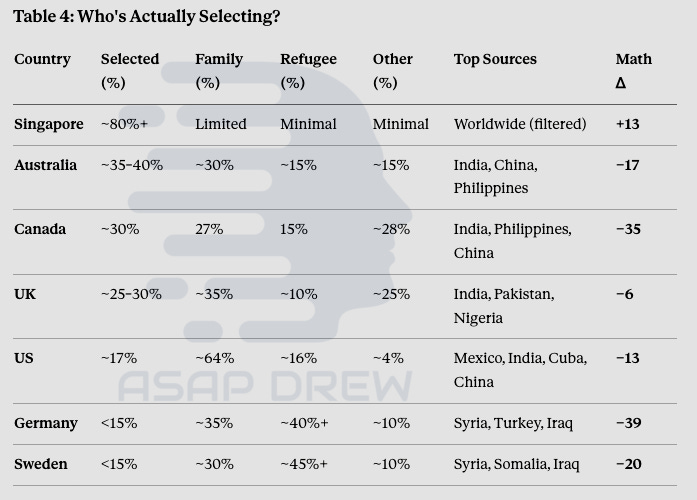
Note: “Cognitively selected” = principal applicants who passed skills/education/points screening. Does not include their accompanying family. Percentages are approximate, based on recent immigration statistics from each country’s official sources.
The table reveals the con.
Canada’s “points system” (praised by many) produces a stream that is only about 58% “economic class” — but even the “58% economic class” includes accompanying spouses and children who are not themselves selected on any criteria.
The actual principal applicant who passed cognitive screening is well under a third of total immigration.
The remaining 42%: family reunification (27%) and refugees (15%) — enters with zero cognitive selection.
Top source: India (25% of all new permanent residents in 2024), where immigrant selection captures the upper tail of a 1.4-billion-person distribution, but the average Indian immigrant to Canada is not an IT engineer.
The Philippines and China round out the top three. Canada’s math score has dropped 35 points since 2003 — worse than Germany; Manitoba alone fell 58 points.
Proportion of students below basic proficiency rose 7 percentage points. So much for the model.
The United States is even worse.
Roughly two-thirds of all permanent immigration is family-based. Only ~17% is employment-sponsored (and even those include dependents).
The diversity lottery adds another ~4% selected on nothing but country of origin and a high school diploma.
And this doesn’t count the estimated 11+ million unauthorized immigrants; overwhelmingly from Mexico and Central America, overwhelmingly unselected.
The US immigration system is, in practice, a family-chain migration machine that reproduces the cognitive distribution of its source populations with only modest upward filtering.
The Swiss natural experiment remains the cleanest causal evidence for selection effects. When Switzerland shifted from (1) low-skill guest workers to (2) EEA free movement (higher-skilled), first-generation immigrant PISA scores improved by 43 points in a single decade. Blinder-Oaxaca decomposition attributed approximately 75% of this gain to the changed characteristics of the incoming immigrants. Not better schools… not more spending… different people.
The Richwine dissertation (Harvard, 2009) used NLSY data to document the multigenerational trajectory of unselected Hispanic immigrants in the US. First-generation: substantial gap below White natives.
Second-generation: improvement, but still well below.
Third-generation: further improvement, but still approximately 0.5–0.75 SD below the White mean.
The environmental uplift of growing up in the US produces gains, but it does not produce convergence with the majority White mean.
The descendants of unselected immigrants converge toward a mean that is higher than the origin country but persistently lower than the native population.
This is not a one-generation lag that education spending can fix. It’s a multigenerational pattern reflecting the bounded effects of environmental improvement on cognitive potential.
And it’s happening everywhere, in every country, at every income level — because no Western country actually selects the majority of its immigrants on cognitive ability.
The only system that does is Singapore. And Singapore gained 13 points.
The Double-Whammy: Replacement + Dysgenic Fertility
This is the core of the entire thesis, and it’s why no amount of educational reform will reverse the trend. Two simultaneous forces are pulling the cognitive mean of every Western nation downward:
Between-group replacement: Higher-scoring native populations (below-replacement fertility) are shrinking as a share while lower-scoring immigrant-origin populations (above-replacement fertility) are growing.
Within-group dysgenic fertility: In every racial and ethnic group, the least cognitively able members are having the most children.
Both forces operate simultaneously and compound across generations. The test score decline is not a temporary blip — it’s the measurable surface expression of a structural genetic and demographic transformation.
It’s not just between-group replacement. Within every racial group, the least cognitively able are outbreeding the most.
US Total Fertility Rates by maternal education (2019 CDC/NCHS): women without a high school diploma have a TFR of 2,433 per 1,000 — well above replacement. Women with a bachelor’s degree: 1,396 — deeply below replacement. That’s a 1.74x fertility advantage for the least-educated. Since education correlates with IQ at r ≈ 0.55–0.65, this is direct dysgenic pressure.
By race: Hispanic TFR is 1,939 (near replacement). Black: 1,774. White: 1,610 (far below replacement). The group with the highest tested cognitive scores (White) has the lowest fertility. Within the White population, the most educated women (bachelor’s+, TFR ~1.4) are being outbred nearly 2:1 by the least educated (no diploma, TFR ~2.4).
Kong et al. (2017, PNAS), using deCODE genetics data on 129,808 Icelanders, showed that polygenic scores for educational attainment have been declining at ~0.30 IQ points per decade — measurable genetic deterioration documented at the genomic level in one of the most homogeneous populations on earth.
The total picture: between-group replacement (higher-scoring groups shrinking as share of population) PLUS within-group dysgenic fertility (lowest-IQ members of every group having the most children). Both forces pulling the population cognitive mean downward simultaneously, compounding across generations.
The Bratsberg-Rogeberg Finding: Why The Establishment Loves It And Why It Doesn’t Matter
The study everyone cites against the demographic thesis is Bratsberg and Rogeberg (2018, PNAS), which tracked IQ scores of Norwegian military brothers and found the Flynn Effect reversal occurring within families — Brother A (born 1965) scoring higher than Brother B (born 1970) in the same household. The conclusion everyone draws: “It’s environmental, not genetic! Brothers in the same family!” Three problems.
First, the birth order confound. Black, Devereux & Salvanes (2005), using the exact same Norwegian military data, found first-borns score ~2–3 IQ points higher than second-borns. This is one of the most replicated findings in the IQ literature. B&R’s “temporal decline” is necessarily comparing an earlier birth order to a later one — you cannot separate “born later in calendar time” from “later birth order” within the same family. The confound may account for a substantial or complete share of their effect.
Second, paternal age. Brother B has an older father at conception by definition. Older fathers contribute more de novo mutations — ~1–2 per year of paternal age (Kong et al., Nature 2012). If B&R’s within-family decline is partly driven by accumulated mutational load, they’re detecting microgenetic deterioration — a genetic mechanism that confirms the hereditarian position, not the environmentalist one.
Third: magnitude. Even if 100% real and entirely environmental, the effect is ~0.2–0.3 IQ points per birth-year — 2–3 points per decade. Compare: Germany’s native-immigrant gap is 59 PISA points. Sweden’s post-SES gap: 54 points. US White-Black gap: ~15 IQ points. These are not the same order of magnitude. B&R is a footnote being cited as if it refutes a tsunami. The within-family design holds family genetics constant by definition — exactly the variable the demographic thesis says is shifting at the population level. It’s like measuring temperature inside a thermostat-controlled room and concluding climate change isn’t real.
What B&R actually shows: in addition to the compositional shift, birth order effects, paternal age mutations, and genuine environmental factors are also pulling scores down within families. Additive, not alternative. The situation is worse than demographics alone.
The Feedback Loop Everyone Ignores
Here’s where the conventional “good teacher effect” narrative really breaks down: educational quality is downstream of population quality, not the other way around.
The causal chain runs like this:
High-IQ parents cluster in affluent suburbs through sorting on income, which is itself substantially determined by cognitive ability.
They fund schools through high property taxes, creating per-pupil spending that dwarfs urban districts (even adjusting for cost of living).
Good teachers want to teach there because the students are teachable, the parents are engaged, the classrooms aren’t behavioral management nightmares, and the pay is competitive.
Students absorb the material because they have the cognitive substrate to do so, reinforced by home environments where educated parents supplement schooling.
Test scores are high. Everyone attributes this to the great teachers and great schools.
But the causal arrow runs primarily from student quality → teacher quality → school quality, not the reverse.
The Chetty et al. teacher value-added findings are real, but they’re substantially confounded by this sorting. Put those same “great teachers” in Baltimore or Detroit and the outcomes track the student population, not the teacher.
Finland is the proof case in reverse. Finland got elite teachers (top 17% of applicants, master’s degrees required) because it had a homogeneous, high-IQ population that was genuinely teachable.
Teaching was a high-status profession because the work was intellectually rewarding.
As Finland’s demographics shifted and classrooms became harder to manage, teaching enrollment has started to decline — the same pattern the US experienced decades ago, just on a lag.
In the US, education majors now score 28 points below the SAT average and have the lowest GRE Quantitative scores of any graduate field (149 vs. 161 for engineering).
Teaching enrollment is down 33% since 2010. Smart people with options don’t sign up for work that increasingly consists of behavioral management for students who lack the cognitive capacity to absorb the material.
The “good teacher” is mostly a byproduct of the good student — and both are a byproduct of the genetic stock of the parents and the community that funds the school.
The AI-Assisted Learning Bifurcation
The same technology is producing radically different outcomes depending on the cognitive substrate of the user. NAEP data: the 10th percentile of 8th-grade readers fell 10 points between 2013 and 2019 (before COVID) while the 90th percentile held steady.
Khan Academy’s Khanmigo exploded from 68,000 to 700,000 users in one year, with meaningful gains for engaged students. But the Khan Academy CLO actually reports: some students engage exactly as designed, “answering questions and posing their own to deepen understanding.” Many others respond “I don’t know” or “Bro, IDK.”
High-ability kids use AI tutors, Claude, ChatGPT, and self-directed platforms to learn at accelerated pace, often routing around the school system entirely. A motivated 14-year-old with a 130 IQ can learn calculus or Python with no teacher and no per-pupil spending. The technology amplifies existing cognitive capacity.
Alpha School — Compresses all academics into two hours of AI-driven adaptive learning per morning. Their students learn 2.6x faster on average, top 20% at 6.5x, scoring 99th percentile on MAP across nearly all grades and subjects. First graduating class: 11 of 12 to four-year universities.
Mentava does the same for gifted early readers. AI-driven phonics with human coaching for high-ability kids whose needs aren’t met by age-normed classrooms. These schools don’t work because of better pedagogy. They work because $75K tuition selects from the right tail of the cognitive distribution, and AI removes the artificial pace constraint. The technology doesn’t create ability. It unleashes ability that was already there.
When Arizona greenlit Alpha’s charter model for public funding (”Unbound Academy”), Pennsylvania rejected the identical application: “untested and fails to demonstrate alignment.”
They’re both right. It works for Alpha’s population. It won’t work for the population Pennsylvania is worried about.
Low-ability kids get the same technology and respond “Bro, IDK.” The tool can’t create cognitive capacity that isn’t there. Same technology, radically different outcomes, determined entirely by substrate. The schools where AI tutoring “works” were already producing good outcomes. The ones where it produces “Bro, IDK” are where no intervention has ever worked at scale — because the constraint is biological.

Spending More on Quality Education = Lighting Money on Fire
The US spends $16,500+ per pupil nationally, 38% more than the OECD average. We are lighting money on the fire… lighting more on fire… and expect that lighting even more money on fire will somehow eventually produce a positive ROI. This is like “effective altruists” sinking gazillions of dollars into developing countries — it just expands the problem; gene editing and embryo selection was always the only serious long-term fix.
Who’s actually winning?
Estonia: ~$8,500/pupil → 1st in Europe, 6th globally in PISA math
Japan: ~$10,000/pupil → +13 points, now 1st in reading
The United States: ~$16,500/pupil → 34th in PISA math, declining every cycle
Estonia gets 2x the output per dollar because the Estonian substrate absorbs the instruction. Past a certain threshold, additional dollars have zero return because the constraint is biological, not financial.
The Kansas City experiment (1985–1997) settled this empirically.
A federal judge invited educators to “dream” — forget about cost.
Over 12 years, nearly $2 billion: 15 new schools, Olympic swimming pool with underwater observation room, TV/animation studios, robotics lab, 25-acre wildlife sanctuary and zoo, model United Nations with simultaneous translation, field trips to Mexico and Senegal.
Student-teacher ratio fell to 12–13:1, lowest of any major district. Highest per-pupil spending of the 280 largest districts.
Result: Test scores unchanged. Black-white gap unchanged. Dropout rate went up. Nonwhite enrollment rose from 73% to 80%+. “For decades, critics said ‘You can’t solve educational problems by throwing money at them.’ Educators replied, ‘No one’s ever tried.’ In Kansas City, they tried.”
Washington DC: ~$31,000/student — highest in the nation. 8th graders score two grade levels below national norms. DC schools are 64% Black, 19% Hispanic. Results track the population, not the expenditure.
LeBron James’ I Promise School (Akron): $1.4M/year from the Foundation on top of district funding; additional tutors, smaller classes, extended days/year, summer tutoring, wraparound services, guaranteed free college tuition. Everything the education establishment says it needs.
Result: 2 out of 75 seventh-graders passed state math (2.7% vs. 50% state average). Inaugural class: 0% math proficiency three years running. 125th lowest of 3,318 Ohio schools.
Fordham Institute found I Promise students performed worse than matched peers at regular Akron schools. The NYT celebrated the school in 2019. They haven’t written about its test scores since.
Jalen Rose Leadership Academy (Detroit): 97% graduation rate. Math proficiency: 2.42%. You can graduate every kid, you cannot make them proficient.
Head Start: ~0.2 SD initial IQ gains fade out completely by first grade, undetectable by third.
Perry Preschool: same fade-out by age 8. The most replicated finding in educational research — and the one every policy discussion ignores.
The OECD finds spending explains ~54% of performance gaps up to ~$75,000 cumulative spending (ages 6–15), but above that threshold the relationship vanishes. The US is far above.
The ROI is negative: every dollar poured into students who can’t absorb instruction is diverted from students who can. Kansas City spent $2 billion and moved the needle zero. LeBron provided everything money can buy and got 2.7% proficiency. Money buys results only when the substrate can convert it into learning. When it can’t, you get Olympic swimming pools and 0% proficiency.

The Elites Tell You What You Want to Hear… Not What You Need to Hear
No economist, education researcher, or policy analyst can say “test scores are falling because we imported millions of people with lower cognitive potential and the least capable members of every group are having the most children” and keep their job. So they find real but secondary mostly bullshit factors — COVID, phones, teacher shortages, AI offloading — and present those as the whole story.
The audience nods, the op-ed gets published, the grant gets funded.
The Prof G article that generated the viral chart is a perfect case study. Galloway’s team presents the data — PISA falling, PIAAC cratering — and concludes AI and smartphones are making us dumb.
Evidence: ChatGPT users report lower GPAs, brain imaging shows 55% reduced neural activity when writing with LLMs, teachers say kids “don’t think anymore.” All secondary. Not once do they mention that the demographic composition of the tested populations changed. Not once do they note Japan — with the same smartphones, AI, and TikTok — improved because it didn’t change its demographics. And they fail to do the arithmetic on shifting 16.5 percentage points from a group averaging 275 to one averaging 257.
Why not? Because the AI/attention thesis is publishable, shareable, and implies solvable problems. The demographic thesis is unpublishable, unshareable, and implies problems no regulation can fix.
The NBC News explainer presents B&R as having “punctured” dysgenic and immigration theories; we already highlighted how idiotic that populist take is.
The WEF version does the same (shoving their heads as far up their asses as possible).
Neither mentions the within-family design cannot detect compositional shifts by construction because doing so would make the article unpublishable.
Kansas City proved spending doesn’t close gaps.
LeBron proved wraparound services don’t.
Head Start proved early enrichment can’t permanently raise IQ.
But the New York Times will never run “It’s the Demographics, Stupid” because the implications are socially unacceptable — even if they’re empirically unavoidable and obvious to anyone with a functioning brain without an advanced case of the Woke Mind Virus.
What will actually fix test scores?
(Besides what everyone has been trying to do which is just: making all tests easy as fuck so that everyone “does well.” This is test inflation… and it’s rampant as well… and these declines are happening with test inflation… an even worse look.)
If you are serious about fixing this… we need rapidly scaled intelligence upgrades in humans that didn’t evolve for the recent cognitively-demanding times.
1. Highly selective immigration. This is the single highest-leverage policy. Canada’s points-based system produces immigrants who outscore natives. The US family-reunification system and Europe’s humanitarian intake produce the opposite. The Swiss natural experiment proved that changing immigrant selection criteria alone can move PISA scores 43 points in a decade. Every percentage point of the population shifted from high-scoring to low-scoring groups moves the national cognitive mean downward. This is arithmetic.
2. Stop wasting money on “closing gaps” that are biologically constrained. Education spending should be redirected from futile attempts to equalize outcomes toward efficiency and discipline. For lower-performing populations, the focus should be on vocational training, behavioral discipline, and practical skills — not on forcing academic content that isn’t being absorbed. For high-performing populations, remove obstacles and let AI-assisted technology amplify their ability.
3. Phone/social media restriction in schools. The highest-ROI near-term intervention. PISA 2022 data shows 15 points of benefit. Japan’s low distraction rates (18% vs. 59% OECD) correlate with maintained scores. This doesn’t fix the structural problem but slows the environmental bleed.
4. Bioenhancement — the only real long-term solution.

Embryo selection with Herasight et al.: current technology could plausibly produce 5–15 IQ point gains per generation across all groups. This raises the cognitive floor for everyone. Eventually use WGS.
Somatic gene editing for intelligence/cognition once the relevant variants are characterized and delivery mechanisms mature. I have a protocol that I will release soon and by the 2030s-2040s people can test if they want.
Age reversal (Operation Senolysis) to extend the productive lifespan of high-human-capital individuals. Every high-IQ person who dies at 75 instead of 150 is an enormous loss of productive capacity and institutional knowledge.
These are the only interventions that address the underlying biological constraints rather than trying to paper over them with spending that demonstrably doesn’t work.

The Human Capital Cliff Is Here
The chart that went viral this month isn’t showing a temporary dip from COVID or smartphones — it’s showing the leading edge of a structural transformation that has been building for decades and will accelerate.
The developed world built its institutions, economies, and technological infrastructure on a population with a certain cognitive profile. That population is being replaced — through differential fertility and unselected immigration — with one that has a different profile. The aggregate cognitive mean is falling. The test scores are the canary.
You can restrict phones. You can fire bad teachers. You can pour another $200 billion into schools. None of it will reverse the tide, because the tide isn’t about schools. It’s about who is sitting in them — and who their parents are, and what genes they carry.
The only question is whether we develop the biotechnological capacity to raise human cognitive potential — embryo selection, gene editing, aging reversal — before the human capital cliff becomes unrecoverable. That’s the real race. Everything else is rearranging deck chairs.
Note: This is why the whole Brad Gerstner’s “Invest America” idea is well-meaning but misses the mark because he assumes the new demographics won’t just cash out and blow the investment the moment they turn 18. “Skin in the game” only matters if it’s your skin… and only matters if you have the genetics to delay gratification and appreciate the market doing long-term work. It will have zero effect on demand for socialism in the younger, more Hispanic cohort.

