

Scott Alexander’s Political Backflow from Europe opens with a useful concept: “America-brained” discourse in Europe (BLM marches in countries with few Black people, defendants demanding First Amendment rights in countries without constitutions).
He then highlights the inverse: American conservatives importing EU immigration narratives (no-go zones, grooming gangs, sharia law) that don’t map onto American realities. Scott is correct to point this out.
His thesis:
“The American conservative narrative on immigration is mostly true in Europe, mostly false in America, and it is more pleasant to think about the places where your narrative is mostly true.”
He defines “the conservative narrative” as “that immigrants are often parasites and criminals,” argues U.S. asylum seekers likely have lower crime rates than natives, and recommends forcing debates with conservatives “back to the American context, where they’ll have more of an uphill battle.”
My position: Scott is right that U.S. conservatives often import European imagery that doesn’t fit America. But the policy debate isn’t “Are first-gen immigrants better or worse than the average native-born American?”
Can we count on favorable outcomes at scale over multiple generations?
Do we measure well enough to know? (No lifetime NPV + country-of-origin + pathway data)
Is our current policy optimal for the future of the U.S.? (“Better than Europe” isn’t a high bar… “better than our existing strategy” probably isn’t either.)
FYI: I’m pro-immigration if selected for proper fit (talent x ethos). I’m also pro-Netherlands-style measurements.
Scott makes two errors:
Epistemic. He treats a favorable first-gen blended average as if it settles a generational policy question.
Diagnostic. He misidentifies why conservatives care about immigration in the first place.
The crux
Highlighting a first-gen snapshot average is misleading.
Conservatives care about 2 things:
Foreign-born impacts right now (lifetime NPV, crime tracking, hidden welfare/benefits, fraud, enforcement burden)
New citizen blocs created over the next 2-3 generations (lifetime NPV, crime per capita by country-of-origin/ethnicity, culture/cohesion, ethos/identity, politics)
If we actually published a pathway-by-generation outcomes ledger, we’d know what was happening. Currently we’re flying blind.
A proper ledger should include:
Pathway: Employment-based vs. family-based vs. humanitarian vs. unauthorized/overstay
Generation: First vs. second vs. third+
Outcomes: Lifetime fiscal balance (taxes minus benefits), crime, political behavior
Baseline: A stable third-plus-generation baseline (not a blended “native-born average”)
Origin tags: Country of origin + ethnicity/race (education-matched comparisons)
Controls: Age at arrival, years in country, legal status timeline, naturalization timing
Human capital: Education/job fit, earnings trajectory, tax compliance
Even with perfect measurement, politics can ignore it. Once a citizenship pathway creates a large permanent voting bloc, incentives shift toward protecting and expanding it. But a granular ledger at least forces clarity and stops the debate from being won by blended averages.
1. The Welfare and Crime Claims Don’t Settle It

Scott’s statement:
“The average immigrant is less likely to claim welfare benefits and less likely to commit crimes than the average native-born citizen.”
He admits this is fuzzy and definition-dependent, but still uses it as the verdict ”mostly false in America.”
“Uses less welfare” is misleading
The policy question is lifetime fiscal NPV: (1) Total taxes paid minus (2) all public costs generated by the pathway. This includes:
Direct cash/in-kind benefits (SNAP, TANF, Medicaid, SSI, housing)
State/local services not counted as “welfare” (K-12, ESL, emergency care, courts/policing)
Administrative overhead (case managers, translators, NGO grants)
Charity displacement (private dollars diverted to support the pathway)
You cannot infer NPV from program-list (welfare) participation or “GDP.”
Age composition makes this worse. Immigrants skew younger, so comparing them to a native-born baseline that includes retirees drawing Social Security/Medicare mechanically makes the younger cohort look “low-welfare” unless you age-standardize.
Pathway effects compound it. Asylum/humanitarian inflows push costs into state/local services and admin that don’t show up in the typical “welfare use” program list. “Not-technically-welfare” but just as many extractions under a different name.
Overall: “Uses less welfare” can be simultaneously true and mostly irrelevant.
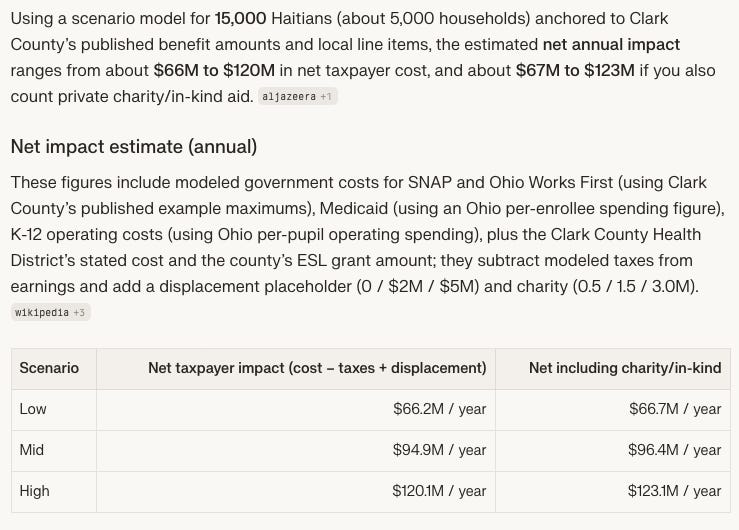
~15k Haitians in Ohio (GPT-5.2 Modeled Estimate)
If we quickly model out all associated costs for the ~15,000 Haitian refugees in Springfield, Ohio (ESL, education, healthcare, housing, EBT/TANF, childcare, transportation, plus job displacement of natives), we’re looking at ~$66.2M/yr (low end) to $120.1M/yr (high end) of net negative fiscal impact.
The crime data infrastructure doesn’t exist
Scott’s own piece:
“There are no good statistics on asylum-seeker crime per se in America.”
He uses incarceration proxies by nationality, informal newness adjustments, and “eyeballing.”
Probably in the right ballpark on first-gen, but you can’t carry “mostly false in America” with the confidence his thesis requires.
Compare this to the Netherlands, which publishes origin- and generation-tagged outcomes and calculates lifetime NPV contributions by immigrant cohort.
You can audit the claim there. The U.S. has nothing comparable.

The gaps are structural, not incidental:
NIBRS doesn’t record citizenship status. The FBI’s primary national crime data program does not collect citizenship status. A Congressional Record: “Most previous research ... has been unable to differentiate undocumented immigrants from documented immigrants.” The discourse does a population swap: demand claims about undocumented crime, the system can’t measure it, widen to “foreign-born” (dominated by legal cohorts), cite as if it answers the original question.
Sanctuary City/State fog. CRS: “Don’t enforce,” “don’t ask,” “don’t tell.” Immigration status becomes sparse, inconsistently recorded across jurisdictions.
Federal/state split. BJS: ~86% of undocumented non-citizens charged federally in 2018 were immigration offenses. State/local systems (where violent and property crime lives) are status-blind. GAO: no comprehensive citizenship info for state/local facilities.
The Texas trap. Texas is paraded as “proof” of status-tagged low immigrant crime. But CRS describes the border strategy as “prevention through deterrence,” a Dallas Fed paper finds linewatch hours deter property crime, and Texas DPS itself flags limitations. High enforcement changes both incidence and detection: a different measurement environment, not a national truth.
Policy-sensitive pipeline. The pipeline (reported → arrests → convictions → incarceration) leaks at every stage: noncitizens deported instead of incarcerated exit the dataset, years-in-country is rarely recorded. PERF reports police staffing ~5.2% below 2020 levels, with immigrant-heavy communities systematically underreporting due to deportation fear, cultural distrust, and language barriers.
“Immigrants” is a category blender
An H-1B engineer, an undocumented border crosser, an Afghan translator, and a visa overstayer share nothing analytically. Collapsing them into one bucket is like averaging pilots and prisoners into “Americans.”
The favorable aggregate is produced by composition.
Most studies in this literature have serious methodological limitations that authors acknowledge in footnotes, but advocates ignore them completely. They use: “foreign-born” when the question is about illegals; rely on jurisdictions with zero measurement or unique deterrence environments; and treat first-gen outcomes as if they predict multi-gen equilibria.
The observability trap
The reason why immigration restrictionists “overindex” on scandals like Feeding Our Future or Tren de Aragua is not because they think these scandals are the whole story, but because they often sense “something is amiss” and are then heavily gaslit by the mainstream media: “it’s not actually happening.”
When it is happening? It’s not a big deal and/or it’s actually a good thing!

Somalis in Minnesota? Exhibit A. Minnesota wasn’t even looking because they were afraid of being called “racist” and Somalis threatened to sue.
So yes, the right-wing knows the left-wing (in extremely progressive states) doesn’t even bother looking… wool remains firmly over the eyes 24/7 until the Feds step in… and by then the ammo is: “Omg stop being racist” or “According to WokeGPT that needs proper context.”
The left demands concrete proof (peer-reviewed, RCT, independently-confirmed, etc.) when the entire system is designed to not actually look for the proof. If and when the proof is looked for, evidence is routinely hidden, obfuscated, or downplayed.
In a system where the main national crime database doesn’t record citizenship, sanctuary jurisdictions suppress the variable, and immigrant communities systematically underreport, “absence of evidence” is not a neutral readout of reality in the United States.
2. The First-Gen Mirage

This is the most important point most people miss.
Scott’s strongest evidence is first-gen incarceration rates by nationality.
Probably directionally correct, but they describe a snapshot, not a trajectory, and the trajectory what matters most.
Gen 1 looks clean
First-gen “law-abiding” status is the predictable output of catastrophic incentive engineering: any charge can mean deportation and family destruction.
This deterrence effect is non-heritable. The next generation faces no such threat. A temporary survival instinct is being miscast as a permanent characteristic.
Generational laundering
First-gen low crime gets credited to “immigrants.” Their U.S.-born children (full citizens, no deportation threat) converge upward in crime rates, but those outcomes get filed under “native-born American crime.” The long-term cost is laundered out of the immigration column.
National Academies (2015): “In the second and third generations, crime rates increase and resemble that of the general population.”
NIJ confirms the first-gen pattern diminishes in subsequent generations.
An undocumented crosser who has a child on U.S. soil creates a “native-born American citizen” in every dataset. First plus second generation account for roughly 1 in 4 Americans (~25% of the country).
International confirmation
Scott treats European data as categorically inapplicable. But wherever countries track outcomes granularly, the “better-than-native-born” is exposed as a mirage:
Sweden (Brå): Born abroad ~2.5x as likely to be suspects; second-gen is the highest group.
Norway (SSB): Overrepresentation highest among Norwegian-born with two immigrant parents.
Denmark (Justice Ministry): Male non-Western descendants’ age-corrected group violence index = 384 (~3.8x expected).
Obviously the U.S. can’t import the magnitudes from Europe, but the pattern holds everywhere it’s actually measured. The U.S. isn’t measuring.
The baseline is rigged
BJS: White male imprisonment rate was 332 per 100,000 in 2020; Black males 5.7x that. Comparing a deportation-constrained first-gen cohort against this blended average mostly guarantees a favorable result by composition math.
The most honest comparator is a stable 3rd-gen+ White baseline; not a blended national average that bakes in subgroup dispersion and descendant absorption.
Favorable-looking aggregates may also be sustained by the existing White population whose different time preferences, investment patterns, institutional behavior, corruption levels, tax contributions, and philanthropic activity still anchor the system.
Immigrants plus their 2nd-gen and 3rd-gen descendants are currently ~28% of the U.S. population and growing.
If a human-capital cliff hits as the demographic center of gravity shifts, the effects could be severe. No first-gen snapshot will have predicted it.

3. Why Conservatives Actually Care

The major dispute in 2026 America isn’t “Are first-gen immigrants criminals?”
Conservatives care about: (1) which immigrants via which pathways, (2) multi-generational effects, and (3) whether the U.S. is running a smart immigration policy for future prosperity, quality-of-life, and social cohesion.
The concern about Europe is genuine but secondary
White Americans feel civilizational ties to European nations and are disturbed watching those countries degrade through mass migration while political elites refuse to name the problem and course correct.
But there’s also a pragmatic reason: European countries like The Netherlands collect granular data; the U.S. doesn’t.
If you can’t audit your own system, you look at places where the data exists and wonder how much you’re being gaslit.

Scott concedes the European concern is valid (”mostly true in Europe”).
And he’s probably correct that first-gen immigrant outcomes in America are superior; but we also have a better upper tail that could be carrying the load and distorting the “average.”
Additionally, “mostly true in Europe” does not mean the U.S. has anything close to an optimal immigration policy.
Blocking immigration of elite human capital would be bad (esp if aligned with American ideals), but what about blocking others (unfiltered/unselected)?
We don’t have sufficient NPV data to elucidate multi-generational impact.
Considering the pace (rapid) and magnitude (substantial) of recent demographic change (historically unprecedented territory), it’s reasonable to err on the side of caution until we actually collect detailed, granular lifetime NPV data.
The primary driver is domestic
Americans don’t need European stories to see what’s happening.
Pew: Over 5.7 million Border Patrol encounters in FY2022-2024 before the crackdown.
People saw the country rapidly changing under Joe Biden (2020-2024).
Prototypical mostly White communities (pre-COVID) transitioned into looking like Mexico City enclaves (post-COVID); changes in culture, communication, cohesion, ambient noise, orderliness, etc. ~per capita were apparent.
This has nothing to do with importing anything from Europe.
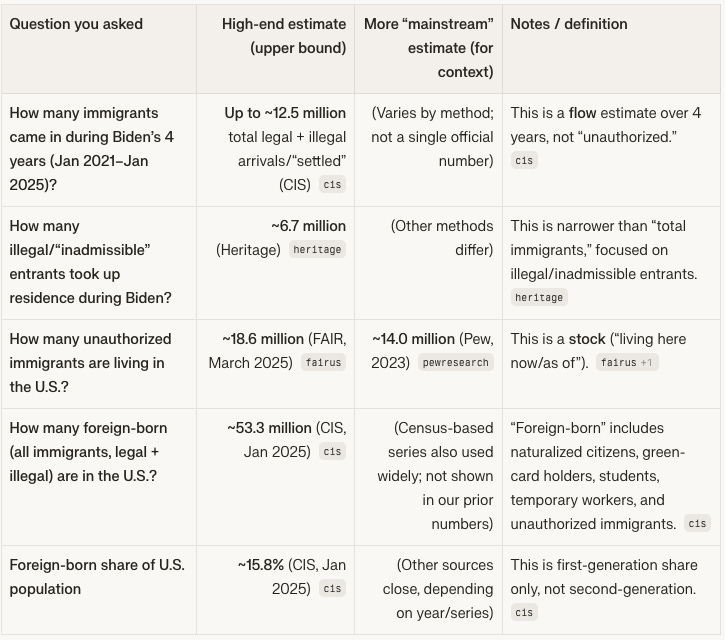
~12.5 million total immigrants entered under Biden’s 4-year-term (the highest ever under any presidential term).
~6.7 million illegals took up residence.
~14-18.6 million unauthorized immigrants are living in the U.S. as of 2026.
~53.3 million foreign-born immigrants are living in the U.S.
~15.8% of the U.S. is currently foreign-born.
Historic immigration was different.
Early waves had zero or minimal safety net; free healthcare, housing vouchers, food banks, and NGOs didn’t exist. The Immigration Act of 1924 was designed to preserve the existing ethnic composition, social cohesion, and the foundational ethos.
Even with all “White Europeans,” assimilation was difficult: intense ethnic rivalries, discrimination, and social friction. But the environmental filters were challenging and the welfare infrastructure thin enough that the filter selected for people who could, on average, build and maintain institutional capacity.
The Hart-Celler Act (1965) abolished those quotas. Its sponsors promised it wouldn’t change the demographic composition of the U.S.; that promise has been falsified beyond recognition.

Other countries have learned from this. Poland and Hungary refused the EU migration pact on explicitly sovereignty grounds, asserting the right to decide who enters and in what numbers, the same principle the U.S. maintained for four decades and then abandoned.
The current immigration system is not highly skill-selected.
Green card admissions over FY2014-FY2023:
~64% family-sponsored
~16% employment-based
~12% refugees/asylees
~4% diversity lottery
~4% other
Of foreign-born individuals, Pew estimates ~14M (27%) were unauthorized in 2023.
Among immigrant adults 25+, education is barbell-shaped: (A) 24% lack a high school diploma (vs. ~8% of native-born) and (B) 36% have a bachelor’s or higher (questionable caliber vs. U.S. degrees).
Is this composition terrible? Probably not. Better than Europe? Sure. Near-optimal for the future of America? Unlikely.
California is the cautionary example
Non-Hispanic Whites: 76.3% in 1970 to 33.6% today. Republican presidential lock: carried in 9 of 10 elections from 1952-1988. Flipped 1992, now a permanent progressive uniparty. This directly tracked demographic change. What followed?
Highest state income tax in the country (13.3%)
Prop 47 decriminalizing theft under $950; organized retail theft driving store closures
~45% of the nation’s unsheltered homeless despite being 12% of the population
$23,791 per-pupil spending (2023-24) tripled in real terms since the 1970s with achievement gaps by race/ethnicity barely budging
Reparations task force recommending up to $1.2M per eligible Black resident in a free state that never practiced slavery
Proposed wealth taxes with billionaires and businesses fleeing for TX, NV, etc.
Anti-White discrimination with DEI quotas despite Whites no longer being a majority.
Demographics don’t explain every “California problem,” but when the electorate changes enough, policy equilibrium can change permanently.

Voting patterns confirm the mechanism
In modern U.S. presidential politics, big Hispanic voting blocs have not been reliable majorities for the party closest to the foundational-ethos bundle: (1) lower taxes, (2) tougher crime policy, (3) smaller welfare state, (4) stronger border enforcement, (5) fewer regulations. (Both parties are far detached from the foundational ethos, but the modern R-party is a bit more closely aligned.)
Whites: 55% Trump
Blacks: 83% Harris
Hispanics: 51% Harris
Asians: 57% Harris
The ~48% Hispanic Trump vote is cited as a “shift,” but it still wasn’t a majority and came at a cost: within the GOP coalition, Hispanic Republicans (58%) are far more likely than White Republicans (21%) to say “government should do more.”
Each party is shifting away from original American principles in attempt to get the Hispanic vote:
Populism, Social Conservatism, Fiscal Liberalism, Bigger Gov (Republicans)
Socialism, DEI, More Regulations, Censorship, Bigger Gov (Liberals)
Composition changes the weighted average of policy preferences mechanically.
And Hispanic trends are relatively predictable because the global pattern remains relatively consistent.

First-gen political alignment isn’t durable
Even when first-gen immigrants are unusually conservative (Cuban Americans who fled Castro, Vietnamese who fled communism), that alignment attenuates across generations.
Cuban Americans voted heavily Republican in generation one; their grandchildren revert toward the broader Hispanic mean.

The pattern is clear: first-gen anti-socialist alignment attenuates because the selection pressure attenuates.
Direct memory of regime failure fades, the incentive environment changes, peer effects dominate, and parties target the median descendant, not the traumatized exile cohort. You can’t bank on first-gen alignment as a durable asset.
Think of it like an obese person who hits a health crisis, goes on a strict diet, and moves to a better environment. The crisis produced the behavior change. The underlying predisposition didn’t change, and the kids revert to the baseline.
We’re in unprecedented demographic territory
Not just in foreign-born share (near its all-time high at ~14.3% as of 2023, per Census) but in overall composition. Non-Hispanic Whites went from ~85% in 1960 to ~57.5% today, with majority-minority projected within a generation.
The last comparable wave (1880-1920) was overwhelmingly European, culturally proximate populations assimilating into an existing Anglo-Protestant framework.
We have essentially no data on what multi-generational outcomes look like at these composition ratios because the experiment has never been run. Anyone claiming to know how this ends is extrapolating from a sample size of zero.
The Somali fraud case illustrates the pattern
Scott acknowledges the Feeding Our Future fraud (77+ defendants, $250M+ stolen), then minimizes: “obviously much less bad than grooming gangs.”
He implies we know the full extent of the Somali situation in MN (unlikely) and that we’d have detected all similar situations across the U.S. (unlikely).
It’s important to highlight that MN Medicaid fraud is under investigation; this is one additional component… there could be more.
In other words: the actual scope of ethnic-enclave fraud that remains undetected / unknown is plausibly much larger than what’s been caught and publicized.
And “less bad” doesn’t really mean much… it’s still nightmarish. Interestingly, he’s grading American concerns against European ones, the exact backflow he’s critiquing.
There’s a lot more under the surface than is known; CRS documents the broader pattern: mismatched SSNs, fraudulent birth certificates, a large unauthorized underground economy.

4. Even If Everything Scott Says Is True

Grant the premises: (1) first-gen immigrants commit less crime, (2) use less welfare, and (3) America’s immigrant pool is far better than Europe’s.
What happens when you run this policy at scale across generations?
The talented tail distorts the average
NFAP: ~64% of U.S. billion-dollar startups were founded or cofounded by immigrants or their children. That tail is highly valuable.
But the Manhattan Institute is explicit: high-skilled groups offset low-skilled groups in the blended average.
We know the elite tail justifies itself, but we should be asking whether the high-skill tail justifies the millions who enter via non-skilled and/or unauthorized pathways.
The answer is probably not — and leveraging the most talented immigrants is how the “averages” get turned into propaganda.
GDP is a size metric, not a welfare metric
National Academies: “GDP up” can coexist with “median citizen worse off.”
Much of immigration-linked GDP growth is recursive: more people creating demand for housing, schools, healthcare, translation services, which shows up as “economic activity” while per-capita productivity stagnates.
Unless you’re tracking fiscal contribution and extraction granularly by origin, pathway, education, and generation over a full lifetime (the way the Netherlands does), “immigrants boost GDP” is an unfalsifiable slogan.
Population size doesn’t drive prosperity; human capital distribution does
Easterly & Kraay (2000): Small states don’t underperform.
Kirkegaard (2025): Population predicts nothing positive across twelve models; significantly negative in half.
During the 1880-1920 wave, immigrants entered an industrial economy with no welfare state and brutal environmental filters that selected for traits building institutional capacity.
Today’s economy demands high human capital, the welfare state subsidizes low productivity, and the skill mismatch is far worse. Adding headcount with the wrong distribution doesn’t just fail to help; it predicts worse outcomes.
Low-skill immigration prevents automation, and AI makes this existential
Germany (allocation study): More low-skilled labor → less automation innovation.
Denmark (firm-level): More migrants → fewer robots.
Japan & South Korea: Highest robot density, most restrictive immigration. Not a coincidence.
Scott himself co-authored AI 2027, which predicts superhuman AI potentially arriving very soon. Importing generic low-skill human labor just before (what’s being touted as) the most consequential technological transition in human history makes zero sense.
Why? Companies automate slower because they fill positions with human labor. This makes the U.S. less competitive. And when companies attempt to automate, there are more people who will unionize and form political coalitions against AI/automation; making things more difficult akin to the ILA port extortion.
Fiscal accounting is composition-dependent
Manhattan Institute 30-year net fiscal impact by education: no diploma, net cost ~$130K; high school, break-even; bachelor’s, net gain ~$1.6M; advanced degree, net gain ~$3.1M.
The National Academies: a lower-education mix would be “much less positive or much more negative.”
What fiscal studies don’t capture:
Underground economy. Studies acknowledge undocumented immigrants “work in the underground economy and possibly engage in tax evasion.”
Labor market displacement. The National Academies’ own synthesis: negative effects concentrate on prior immigrants and native-born high school dropouts.
Identity fraud. SSA’s Earnings Suspense File has accumulated over $1.5 trillion in wages with mismatched identifiers through 2016. DOJ: 119 prosecuted for stolen SSNs in one operation. CRS documents the broader pattern.
Smuggling and gang networks. Treasury’s Tren de Aragua designation, CRS MS-13. All siloed across databases or never recorded.
That’s the shadow accounting “net fiscal positive” claims assume away.
The filter should be talent x ethos, not just “STEM”
Kirkegaard (2025): Even standardized screening yields dramatically different true human capital by origin, with gaps widening under lenient thresholds.
With AI rapidly commoditizing technical skills, importing generic “STEM workers” isn’t the slam dunk it was a decade ago; talent alone isn’t sufficient.
The ideal immigrant raises per-capita innovation, pays more in taxes than they extract over a lifetime, and wants to be American in the foundational sense: limited government, individual liberty, rule of law, civic reciprocity.
They should be filling jobs that the country needs filled… not recursive loop jobs created by unfiltered immigration (translation x social services x etc. for other immigrants).
So the idea is: Talent x Alignment. Not “more immigrants” or “more STEM.” As talented immigrants can effectively leverage resources for anti-American ideals (e.g. advocate for socialism, open borders, etc.).
5. Returning to the American Context

Scott concludes:
“The more honest and politically practical course would be to acknowledge when these stories about Europe are true, then challenge conservatives to return to the American context, where they’ll have more of an uphill battle.”
Alright, let’s “return to the American context.” To actually know the American context requires proper measurement infrastructure and granular data collection instead of debating within blended average fog.
We need to track:
Fiscal: Cohort-level generational accounting by admission pathway x education x age-at-arrival x country of origin x race/ethnicity, including descendants. Lifetime NPV of taxes minus transfers (state x federal x local x charities).
Crime: Generation x country of origin x time-in-country, with consistent recording across jurisdictions, compared against a stable third-plus non-Hispanic White baseline, not a blended average.
Innovation: Tail metrics (patents, founders) separated from mean/median outcomes, so the talented tail can’t launder the median.
Multi-gen: Second, third, fourth generation outcomes by country of origin x race/ethnicity x pathway, because the first-gen snapshot is the least informative datapoint for long-term policy.
The U.S. inflow is not Europe’s. America likely has better immigrants than what Europe is accepting. First-gen outcomes may not be bad.
The problem. (1) First-gen averages are not the primary concern. (2) Newly-minted Americans (second-gen, third-gen) get lumped into the “American average” immediately. (3) We don’t have granular tracking by pathway x origin x ethnicity. (4) We aren’t comparing against the right baseline. (5) The tails may be propping up the whole average. If the tails are having the biggest impact, why are we taking in the others?
And also — why should we think that “better than Europe” is good enough for the U.S.? That’s a low bar to clear. Why aren’t we trying to optimize for the very best we can do? (We can probably do much better than we’ve currently been doing.)
“Immigrants commit less crime and use less welfare” is misleading because it leverages:
Blended averages (not medians)
First-gen only (next gens are “Americans”)
Flawed baseline comparator (”American average” skewed by tails and newly absorbed second-gens)
A system that doesn’t track anything granularly and fails to adjust for fraud, off-books activity, native job displacement, sanctuary black holes, charity extraction, age-composition artifacts, and race/ethnicity/country of origin
The statement as constructed can’t bear the policy weight Scott implies. And all this talk gives the Left-Wing faction a pass for: (1) zero border enforcement and (2) actively helping individuals enter/become citizens in the U.S.
The left-wing plan is clear (actions speak louder than words):
Open borders/don’t enforce border laws
Help immigrants, migrants, asylum seekers, refugees enter/stay
Create sanctuary cities and states to prevent deportation (don’t comply with federal law)
Give handouts: federal, state, local, NGO, charity, etc. (even though they’ll claim they aren’t actually receiving them because they “cant”; yes they can)
Let them exploit citizenship loopholes and create new loopholes or grant amnesty
Zero acknowledgement of off-the-books work (zero taxes, able to undercut American businesses) and displacement of American-born citizens
Gaslight conservatives with questionable datasets that only liberals compiled (GDP went up!, It’s the best data!, etc.)
No granular data tracking: Continue saying impractical or racist to track in-depth and say how ignorant conservatives are.
We saw what happened under Biden (2020-2024). I’m not aware of any Democrat, Liberal, or Progressive that has any plan to enforce the border. Even if they claim they have a plan, will people believe they’ll actually follow it? For many Americans, immigration and border enforcement is the single biggest issue going forward.
That said, I think Democrats as a party don’t have much to worry about. Why? Demographics. The new demographics will flip major states by the 2030s… if Dems win 2026 midterms and 2028 prez, things will accelerate. Republicans will at least slow down the inevitable massive flippening in key states (e.g. Texas).
By that point I can only hope that Scott’s fast-AI trajectory comes true and we have some combination of: (1) AGI/robotics diffusion + (2) bioenhancement (gene mods for IQ, BCIs, etc.) — such that immigration policy won’t matter much. Without that? I predict a non-insignificant decay in U.S. developmental status (adjusting for AI) + gov debt issues + socialism + higher crime (not necessarily in the data) + reduction in quality-of-life/cohesion.
The blunt reality: The U.S. (1) runs a civilization-scale immigration policy without significant filters, (2) refuses to build a granular measurement infrastructure to evaluate it, and (3) declares “immigration is good” despite having zero granular data to audit — while the literature quietly admits that most “immigrant advantages” fade after the first generation. If demographic changes shift per-capita metrics (crime, productivity, innovation, politics, identity) and this compounds across generations, by the time we detect a deleterious signal it’ll probably be too late to do anything about it.