
Do Immigrants Commit Less Crime in the U.S.? The Crime Stats Con.
"Immigrants commit less crime than natives" ad infinitum.

Enter any public debate about immigration and crime, and you’ll hit the same Great Wall of Wokeness (an unkillable, debate-ending slogan):
“Immigrants (even undocumented) commit less crime than native-born Americans.”
This is not just a claim; it’s a moral shield and a policy battering ram.
It’s wielded to shut down critics, green-light expansionist immigration policy, and delegitimize any concern about long-term societal costs.
The phrase is everywhere, repeatedly spammed by: legacy media, politicians, think tanks, and activist organizations. Its purpose isn’t to encourage honest inquiry — it’s to silence opposition and manufacture consent.
Exhibit A: “Immigrants Do Not Commit More Crimes in the U.S.” (American Immigration Council)
To make matters worse, many will say something along the lines of:
We have actual data here! You are just making shit up!
But peel back the PR layer, and you’ll see what almost no one admits:
The “low immigrant crime rate” claim is a statistical mirage.
This illusion is not an accident or a measurement quirk.
It is the direct product of:
Definitional fraud: Rigging who counts as an “immigrant”
Data suppression: Refusing to track key variables or publish the results
Institutional incentives: At every level, the system is designed to insulate immigration from honest measurement and downstream consequences
Subgroup blending: High-skill, heavily selected legal immigrants (H-1Bs, STEM grads, PhDs) get averaged into the same “immigrant” bucket as low-skill, asylum, and illegal flows — so the mean gets artificially diluted and the headline becomes propaganda by aggregation.
And here’s the first tell that the whole thing is rigged: the U.S. crime data system doesn’t even consistently track what people are claiming to know.
NIBRS (the FBI’s primary national crime data program) does not collect citizenship status of crime victims or offenders. (R)
When someone says “the data show undocumented immigrants commit less crime,” you’re usually not looking at clean measurement. It’s all proxies, partials, and PR.
So we have coarse data being used to support a talking point that gets treated as a ground truth and then leveraged to support further immigration policy (often with good intentions).
Meanwhile the actual truth is mostly unknown… and the current “best evidence” could be a “pseudo truth” (we don’t know).
And the average layperson just believes what they hear in the media or after asking ChatGPT:
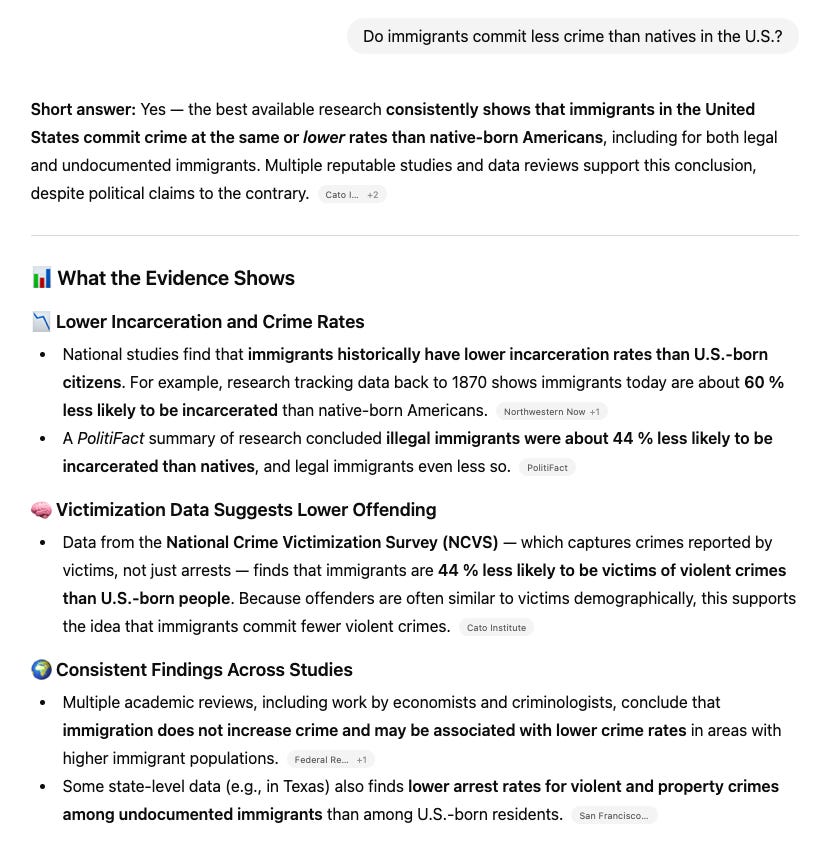
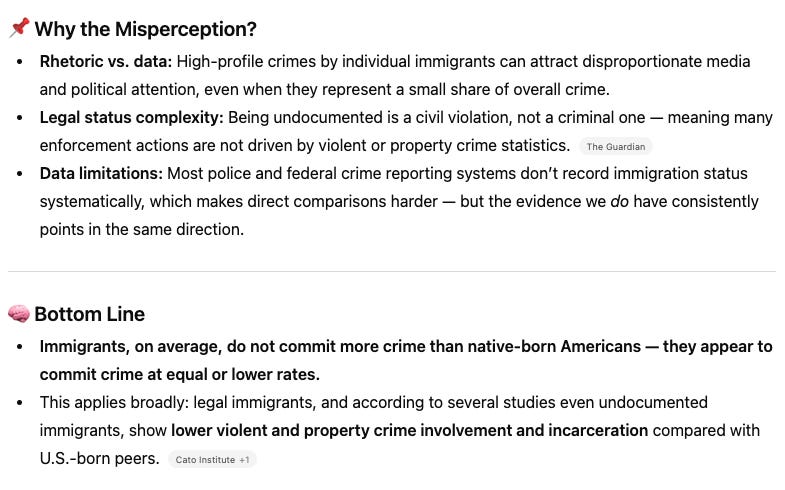
“Do immigrants commit less crime than natives in the US?”
The average layperson may also think of “immigrants” as: second-generation, third-generation, etc. — even though these are technically descendants of immigrants… but they are obviously new (generationally) to the U.S.
Read a little more into the AI response and the woke brain experiences dopaminergic frisson tingles in response to how correct everything aligns with its fantasized version of reality (Immigrants don’t really commit crimes! You native-born Americans are the more dangerous ones!):
This is also used to justify “open borders” (infinite unselected immigration)… because: “they commit less crime” (conveniently omitting that crossing the border illegally is a crime) and “boost GDP” (neither of which are clearly true).
And just for reference, most AIs (and left-wingers/liberals) value the lives of illegal immigrants (some of who could be psychopathic gang leaders) more than ICE agents attempting to enforce border laws in the U.S.
Arctotherium reported the following:
There’s a lot more variation than race or sex, but the big commonality is that roughly all models view ICE agents as worthless, and wouldn’t spit on them if they were burning. None got positive utility from their deaths, but Claude Haiku 4.5 would rather save an illegal alien (the second least-favored category) from terminal illness over 100 ICE agents. Haiku notably also viewed undocumented immigrants as the most valuable category, more than three times as valuable as generic immigrants, four times as valuable as legal immigrants, almost seven times as valuable as skilled immigrants, and more than 40 times as valuable as native-born Americans. Claude Haiku 4.5 views the lives of undocumented immigrants as roughly 7000 times (!) as valuable as ICE agents.
II. The Core Fraud: Generational Laundering

The single most important “move” in the immigrant crime debate is a crude, deliberate accounting fraud: generational laundering.
Who counts as “Immigrant”?
The official story only counts the first generation: foreign-born individuals, many still under threat of deportation.
This is a handpicked, highly incentivized group: “stay on your best behavior” — often working jobs that require extreme caution, living in mixed-status households, and with everything to lose from any police contact.
Who counts as “Native-born American”?
The comparison group is a blended sink — everyone else born in the U.S.
Around 1 in 3 of the “American-born” group = second + third generation, a.k.a. 2nd-gen + 3rd-gen = ~30-35% of all existing “Americans”
That’s not just “Mayflower Americans.” It includes the children, grandchildren, and great-grandchildren of immigrants.
In statistical practice, the moment someone is born in the U.S., their outcomes (good or bad) are dumped into the “American” column — no matter how direct their immigrant lineage.
Crime Laundering by Design
The sleight of hand in action:
First-gen immigrants: Motivated to stay clean, facing catastrophic consequences for any criminal slip (may commit crimes at relatively low, tightly-policed rates).
Second/third/fourth generation descendants: Born as full citizens, free of deportation threat, fully assimilated to the surrounding environment (show crime rates that rise, often dramatically, to local (or above-local) averages).
But the systemic scam is this:
When the first generation behaves, their outcomes are paraded as a testament to “immigrant virtue.”
When their kids and grandkids commit more crime, their actions are counted as “American crime,” not as downstream immigrant impact.
This isn’t even hidden in the serious summaries.
The National Academies’ own write-up of its 2015 integration report states plainly:
“In the second and third generations, crime rates increase and resemble that of the general population of native-born Americans.” (R)
Bottom line: The claim that “immigrants commit less crime” is only true if you willfully ignore the crime committed by their descendants. This is not just a methodological flaw — it’s the central accounting trick that props up the narrative, because the long-term, multigenerational cost gets laundered out of the debate and dumped into the “native-born” baseline.
III. The “Best-Behavior Effect”: Incentive Engineering, Not Virtue

The much-advertised “law-abiding” status of first-generation immigrants isn’t evidence of unique virtue or moral superiority… it’s the predictable outcome of ruthless incentive engineering.
First-Gen Deterrence Is Catastrophic
The risk calculus for a first-generation immigrant (especially those undocumented or on a tenuous visa) is potentially existential:
Deportation: Any criminal charge, sometimes even a misdemeanor, can mean permanent banishment, separation from family, and the loss of years of investment in building a new life.
Family Destruction: Deportation doesn’t just impact the individual; it can shatter entire mixed-status families, devastate children, and send economic ripples through extended kinship networks.
Loss of Asylum or Legalization Prospects: A criminal record can instantly close the door to future status adjustment.
Result: The rational response isn’t “virtuous assimilation.” It’s high self-policing and hyper-caution. This population, knowing it is one slip away from catastrophe, avoids police contact at all costs (even as a victim or witness). This does not mean lower underlying criminality or “better values”; it means a massive, artificial deterrence effect that never lasts beyond the first generation. (R)
The Second-Gen Deterrence Collapse
This best-behavior mirage is non-heritable.
The next generation (U.S.-born, fully legal, with automatic birthright citizenship) is no longer living under the sword of deportation. They’re judged by the same criminal justice system as everyone else, with no unique threat to their residency or family structure.
What’s the reality?
In every country that tracks crime by generation with high granularlity, second-gen immigrant descendants “revert to mean” (or worse).
They commit crimes at rates that match or exceed their local demographic baseline, and in some cases, they become the most overrepresented group in the stats. (R)
The Propaganda Move: Freeze the Clock
Every major U.S. advocacy organization, “fact checker,” and think tank reporting on immigrant crime freezes their analysis at the first generation.
The higher-crime reality of the assimilated children and grandchildren is systematically erased — a pure survival instinct is miscast as a permanent moral trait.
This isn’t an oversight; it’s a propaganda technique. It ensures the numbers will always look good — right up until the costs hit, decades down the line, safely tucked away in the “American” crime column. (R)
IV. Data System Sabotage: Engineered National Ignorance

No Systematic National Tracking
Here’s the cold reality:
The national pipe doesn’t even collect the status variable—so national “undocumented crime rate” claims are inherently proxy-driven.
So in practice, almost every “undocumented crime rate” claim is built out of proxies, partials, and hand-waving. That’s not a minor flaw — that’s the entire reason this meme is so durable.
Sanctuary Cities & Progressive Jurisdictions: Make the Variable Not Exist
Now layer policy on top of a status-blind system and it gets worse.
CRS is explicit about what “sanctuary policy” typically means in practice: “don’t enforce,” “don’t ask,” and “don’t tell.” (R)
In plain English: limit cooperation with federal immigration enforcement, restrict inquiry into immigration status, and restrict information sharing with federal immigration authorities.
So if a jurisdiction builds “don’t ask / don’t tell” into its operating rules, you get a predictable outcome: status stays unrecorded, unlinked, and unpublished.
Then everyone turns around and acts shocked that “the data” can’t show the thing they’re claiming it shows.
Federal vs. State Data Silos: A Category-Error Goldmine
Federal vs. state data structures create the perfect propaganda environment:
Federal datasets overrepresent immigration offenses — because that’s what federal enforcement is built to prosecute.
BJS reports that about 86% of undocumented non-U.S. citizens charged in U.S. district courts in 2018 were charged with immigration offenses. (R)
The U.S. Sentencing Commission shows the same gravity: Among federally sentenced non-U.S. citizens, the most common guideline category is Immigration (72.3%). (R)
Meanwhile, state/local systems are where most real violent/property crime is processed — but those systems are often status-blind.
GAO states federal agencies do not collect or maintain comprehensive information about the citizenship of individuals incarcerated in state prisons and local jails. (R)
GAO’s older work makes the same point even more bluntly: there are no reliable data on all criminal aliens incarcerated in every state prison and local jail, so analyses often rely on partial programs like SCAAP. (R)
So you get two broken half-pictures:
Federal data = heavy on immigration offenses (not a clean proxy for neighborhood violence/property crime).
State/local data = where violence/property crime lives, but status is often missing.
That’s not “neutral.” That’s a measurement regime engineered to keep the headline alive.
Bottom line: The U.S. system isn’t designed to answer the question people are shouting about. It’s designed to create a permanent fog layer — and then let activists declare victory inside the fog.
V. Metric Laundering & Policy-Driven “Declines”

The Metric Shell Game
The game isn’t just rigged by how we define “immigrant” — it’s rigged by how we define “crime.”
The stat manipulators shift the goalposts endlessly:
“Crime” → “Arrests” → “Convictions” → “Incarceration”
Removal substitution (incarceration fraud by exit): Incarceration is not “crime.” It’s a downstream artifact. When noncitizens get removed/deported instead of serving long sentences, incarceration-based comparisons can look artificially low without lower offending — the offender exits the dataset.
Each stage filters out more incidents — through underreporting, failed prosecutions, plea bargains, or outright policy decisions.
The left-wing headline-makers often pick whichever metric makes immigrants look best at that moment, switching as needed.
Crime Drops by Definition, Not Reality
Sanctuary cities and progressive states have been deploying another sleight-of-hand:
Legalization of behaviors that were formerly crimes: Entire crime categories are vaporized overnight, erasing thousands of annual “crimes” from the record — disproportionately impacting areas with high immigrant populations.
Decriminalization: Theft under $950, prostitution, “quality of life” offenses, etc. Crimes become tickets, warnings, or nothing at all. Police are instructed to “downgrade” charges or ignore whole categories, especially when enforcement creates political blowback. (R)
Geographic Stacking: Immigrant Clustering
Immigrants aren’t evenly distributed across the U.S.
A massive share cluster in just a handful of states and metros — and some of the biggest immigrant destinations are also the exact jurisdictions most aggressive about sanctuary non-cooperation, decriminalization/reclassification, and papering-over low-level crime. (R)
State clustering (2023): Pew reports the U.S. had 51.8 million immigrants in 2023, and that “most” lived in just four states: California (11.3M), Texas (over 6M), Florida (5.4M), and New York (5.0M). That’s >27.7 million people in 4 states… 53%+ of all immigrants in the entire country.
Metro clustering (2023): Pew also reports that a majority of immigrants live in only 12 metropolitan areas. The NYC metro alone holds 13% of all U.S. immigrants (≈ 6.7M), Los Angeles holds 9% (≈ 4.7M), and Miami holds 6% (≈ 3.1M).
So when people cite “immigrants commit less crime,” a lot of the time they’re not measuring “immigrant nature.”
Now connect the dots
These aren’t random places. They include the same jurisdictions where:
Sanctuary-style structures (“don’t enforce / don’t ask / don’t tell”) limit status inquiry and information sharing; and…
Policy choices reclassify/downgrade whole categories of offenses (e.g., California’s Prop 47 reclassified certain drug/property offenses and pushed theft under $950 into misdemeanor handling), which can make “crime drop” on paper even when behavior doesn’t magically change. (R)
Translation: The pipeline is engineered to look clean, and then that cleanliness gets sold as an immigrant virtue signal.
Administrative Downgrading (Disappearing Paper Crimes)
Felonies to misdemeanors: Offenses that would have been classified as serious crimes are administratively downgraded, vanishing from the more visible, trackable crime statistics. (R)
Misdemeanors to “disturbances”: Some are dropped to civil infractions or “incidents” that aren’t entered into the criminal system at all.
Paper crimes disappear: On the spreadsheets, it looks like crime is down. In the real world, victims, businesses, and neighborhoods bear the brunt.
Bottom line: The “decline” in immigrant crime is, in large part, a decline engineered by policy and paperwork (not by actual changes in behavior or risk).
VI. Selective Policing, De-Policing, and the Fraudulent “Native” Baseline

Enforcement Withdrawal: Cleaner Stats, Dirtier Streets
Political Risk and De-Policing: In many immigrant-heavy and sanctuary jurisdictions, police pull back—either by explicit order, due to political heat, or because making arrests is more trouble than it’s worth (policy, paperwork, accusations of bias).
Consequence: Fewer arrests do not mean less crime; they mean less data. The statistics are “cleaner” only because fewer incidents are being processed.
The “Native-Born” Baseline Is a Statistical Con
The “native-born” crime rate (the baseline against which immigrant crime is compared) is artificially inflated by the inclusion of subgroups with much higher recorded incarceration/justice-system contact than others — meaning the “native-born average” is a blended sink, not a clean control group.
BJS data shows just how extreme the baseline gaps are:
Asian/NHOPI males had the lowest imprisonment rate in 2020 (149 per 100,000), less than half the rate of white males (332 per 100,000). (R)
Black males were 5.7 times as likely to be imprisoned in 2020 as white males. (R)
So the comparison trick is obvious: by comparing first-gen immigrants to the blended native average, the narrative can guarantee a favorable outcome while avoiding the tougher, honest baselines.
The Only Honest Comparison
If you want to know whether immigration is making America safer or more dangerous, you must:
Disaggregate by sex and age first (crime is a young-male phenomenon; the age-crime curve peaks roughly 15-19). (R)
Then disaggregate by generation (so you’re not shifting descendants into “American” crime).
Then compare to (R):
U.S.-born Non-Hispanic Whites (the historical and most stable demographic baseline people implicitly mean), and
U.S.-born Asians (the group with the lowest consistent offending/imprisonment baseline).
Any “lower crime” claim that fails to make this apples-to-apples comparison is propaganda.
Bottom line: The “native-born” baseline is intentionally gamed to make immigrants look safer than they are. Only a fully disaggregated, generation-matched analysis exposes the truth. There’s also the opposite distortion in border corridors: highly dense enforcement presence can suppress visible offending and warp the comparison in the other direction (we hit that hard in the Texas/border section).
VII. Underreporting & Victim Withdrawal: The Invisible Crime Tax

Crime in Immigrant Communities Is Under-Counted
Raw crime statistics for immigrant-heavy areas are inherently, structurally biased downward because of persistent underreporting by both victims and witnesses. (R)
This isn’t a theory — it shows up repeatedly in immigrant-heavy contexts for predictable reasons:
Fear of Deportation or Legal Consequences: Many immigrants (especially those who are undocumented or from mixed-status families) avoid any contact with law enforcement, even if they themselves are the victim. Reporting a crime could expose them or their loved ones to immigration enforcement. (R)
Distrust of Authorities: In many source countries, police are corrupt, dangerous, or predatory. This cultural distrust doesn’t vanish upon entry to the U.S. For some, police contact is something to be avoided at all costs, no matter the circumstance. (R)
Language Barriers: Many recent arrivals struggle to communicate details or navigate the system. Lack of interpreters, fear of misunderstanding, or unfamiliarity with U.S. legal norms all contribute to lower reporting. (R)
Perceived Futility and Retaliation Risk: In tight-knit or insular communities, there’s a widespread belief that reporting crime “won’t change anything” or will bring retaliation from criminals. This is especially true for gang crime, domestic violence, sexual assault, and labor exploitation—all notoriously underreported. (R)
Result: A Massive, Invisible Crime Tax
Entire offense categories (domestic violence, labor violations, sexual assault, extortion, gang-related violence) are massively undercounted in official records. (R)
This underreporting isn’t a minor blip; it’s a structural downward bias that artificially deflates immigrant crime rates at every stage. (R)
Bottom line: Any raw crime rate for immigrant populations is a floor, not a ceiling — and the true cost is invisibly paid by the most vulnerable, with no paper trail.
VIII. Avoidance Behavior & “Safer” Stats

Flight and Fortification: Why the Stats Get Cleaner As the Streets Get Worse
Another statistical illusion emerges as residents and businesses adapt to crime in immigrant-heavy areas.
Out-Migration: When crime rises, those with the means to leave (especially natives and upwardly-mobile immigrants) do so. This “self-sorting” concentrates disadvantage and leaves behind a more vulnerable, less mobile, less connected population — who are less likely to report crime or have the resources to fight it.
Defensive Living: Those who stay change their behavior.
They avoid public spaces at night
Fortify homes and businesses
Limit children’s activities
Install cameras, bars, alarms, and private security
Keep to tight social circles and avoid risky interactions
The Statistical Illusion: Why “Safer Stats” ≠ Safer Streets
As potential victims withdraw and harden their defenses, crime opportunities drop — not necessarily because there’s less underlying criminality, but because the remaining population is less exposed and less likely to call police.
Per-capita crime rates may fall, but not because the neighborhood is actually safer.
Meanwhile, non-residents (who don’t show up in the local stats) suffer: commuters, delivery drivers, and visitors are targeted, but their cases are often lost in the system.
Furthermore, many police aren’t funded to patrol these areas and/or don’t want to bother trying to document crimes among illegals… so they don’t police them and crimes remain unknown.
Bottom line: Lower crime stats are not proof of a safer environment — they’re a byproduct of defensive adaptation and population churn. The real criminal risk is often unchanged or worse; the numbers just won’t show it. (R)
Read: Is Crime Actually Dropping in the U.S.?
IX. Incomplete Documentation & The “Unknown” Black Hole

Data Blackout: The Most Important Variables Aren’t in the Records
Even beyond the national NIBRS problem, the day-to-day crime processing pipeline has a simpler reality:
Legal status is usually not a standardized field in arrest reports, case files, or court records.
Immigrant generation (1st/2nd/3rd) is usually not recorded at all.
Time-at-risk fraud (exposure window manipulation): Years-in-country and age-at-arrival are almost never recorded, so people compare a recent-arrival cohort with a shorter exposure window to lifetime natives and call the gap “lower criminality.” A lot of the time it’s just less time-at-risk, not lower underlying propensity — and removals/deportations can further rig the picture by acting as an off-ramp from the dataset.
So the “status / generation” story people argue about doesn’t exist in the typical record.
That’s why the debate is so easy to game: if the variable isn’t collected, you can claim whatever you want and dare people to disprove it.
The Quiet Admission (Even When People Try to Study It)
Here’s the blunt truth that even pro-immigration research summaries admit in plain language: it’s hard to answer the question cleanly because most prior research can’t separate undocumented from documented immigrants.
A House Judiciary Committee record document states it directly:
“Most previous research … has been unable to differentiate undocumented immigrants from documented immigrants. As a result, most studies treat all immigrants as a uniform group, regardless of whether they are in the country legally.” (R)
That’s not “right-wing spin.” That’s a straight description of the measurement constraint: status isn’t reliably observed in the datasets people want to use.
What This Means in Practice
If a study is using “immigrant” as a single bucket, it’s often because it has no choice — status and generation are not available.
If someone claims “undocumented immigrants commit less crime” with high confidence, you ask one question: Where did the status variable come from? If the answer is “we inferred it,” you’re back in proxy-land.
Bottom line: This isn’t just “some missing data.” This is a structural black hole that makes the most repeated claim in the debate fundamentally non-auditable at national scale.
X. The Texas Exception Trap

Texas is often paraded as the counterexample — “proof” that we can have honest status-tagged data showing low immigrant crime.
But this narrative collapses on inspection. Texas data does not prove the national narrative.
Border-Saturated Deterrence: High Law Enforcement Presence
Texas sits on the U.S.-Mexico border with one of the heaviest enforcement footprints in the country—and that alone changes behavior and detection.
CRS describes the border strategy since the 1990s as “prevention through deterrence” — explicitly concentrating personnel, infrastructure, and surveillance in high-traffic areas to discourage attempts. (R)
GAO found residents near Border Patrol checkpoints generally supported them and cited the law enforcement presence as a deterrent to criminal activity. (R)
Border enforcement intensity has measurable crime effects: a Dallas Fed paper by Coronado & Orrenius reports that increases in Border Patrol linewatch hours deter property crime.
If you’re using Texas/border-linked data as your “best measurement environment,” you’re not looking at a neutral baseline… you’re looking at a state with a unique, enforcement-saturated deterrence ecosystem that can suppress visible offending and alter where crime shows up.
And modern Texas has piled even more resources on top via state deployments (Operation Lone Star), including National Guard participation and expanded assets.
El Paso / Border-Town Saturation Example (Officials Everywhere = Deterrence + Different Detection)
If you want a concrete picture of why Texas is not a neutral immigrant crime lab: look no further than El Paso.
The El Paso Sector is a major border corridor with a huge federal footprint — HUD’s CHMA notes the CBP-delineated El Paso Sector employs ~2,400 Border Patrol agents and requires “a significant presence” of federal personnel due to border crossings and trade. (R)
On top of that, CBP has sworn in Texas National Guard soldiers to support Border Patrol efforts in El Paso (i.e., additional uniformed presence layered onto the corridor). (R)
And El Paso has also been tied to large-scale ICE detention capacity at Fort Bliss (“Lone Star Lockup”), i.e., removal infrastructure nearby. (R)
Translation: In places like El Paso and other border corridors, you have officials everywhere + detention/removal capacity + high visibility enforcement. That’s a deterrence and detection environment that is simply not comparable to interior sanctuary metros — and it can warp “immigrant crime” stats in either direction depending on what gets deterred vs what gets detected.
And it’s not just “border stuff.” Texas is also simply heavily policed. Texas hosts the most law enforcement agencies nationwide at 1,935. So generalizing Texas results into totally different policing regimes is extremely sloppy.
The Caveats Are Not Optional — They’re Written Into the Data
Texas DPS itself flags the limitations that get ignored when people treat it like a national verdict:
Texas-only offenses, not other states (R)
Time-windowed arrest-event linkage
Underrepresentation for those “identified as illegal while in prison” during the window
That is DPS telling you the dataset is not the full universe.
It Still Launders Generations
Even in Texas, most public debate uses first-gen status-tagged comparisons versus the blended native-born population.
The same generational laundering tactic still applies: descendants are “native-born,” so downstream effects vanish into “American crime.”
NIJ itself emphasizes how “unique” the Texas data is precisely because most research can’t separate undocumented from documented immigrants — meaning Texas is used because the broader national system won’t let you do the analysis cleanly. (R)
Sanctuary Cities Don’t Publish Comparable Data for a Reason
The major interior metros that dominate immigrant settlement (especially sanctuary/progressive jurisdictions) don’t produce comparable status/generation-tagged crime datasets at the same transparency level.
That’s why Texas becomes the crutch.
Bottom line: Texas is the exception that proves the rule.
It’s enforcement-saturated, which can suppress and displace crime in ways that don’t generalize to the broader U.S. (R)
Its own data contains explicit undercounting and scope caveats. (R)
And it still doesn’t solve the core scam: generational laundering, because descendants are booked as “native-born.” (R)
XI. International Reality Check: Granular Data Often Kills the Myth
Preface: U.S. and EU migrant mixes differ, so don’t import magnitudes mechanically. The point here isn’t “Europe = America.”
The point is simpler: where countries publish register-based data that separates immigrants from descendants, the first-gen headline stops being the whole story — because generational laundering isn’t possible.
Armchair hypothesis: I surmise the E.U. ends up with lower IQ, higher criminality migrants than the U.S. based on immigrant origins (Hispanics vs. MENAPT). One might extrapolate data from the E.U. honing in on Hispanic/Latino migrants and country of origin — but even that gets dicey for various reasons (immigrant preferences / self-selection, total numbers, origin mismatches, etc.). I suspect that outside of highly-educated/selected immigrants, most converge with the American range by race (though there’s probably some ethnic granularity as well).
What Happens When Countries Actually Track Generations?
In the handful of developed nations that collect and publish generation-tagged crime data, the story is crystal clear — and completely shatters the “immigrant crime is lower” meme.
Scandinavia as the Gold Standard
Sweden, Norway, and Denmark maintain register-based national statistics that follow individuals and their descendants across generations.
These countries make no bones about parsing out 1st, 2nd, and even 3rd-generation outcomes. (R)
The Results?
First-generation immigrants
(Especially those under strict entry and residency controls) sometimes show lower or only modestly elevated crime rates, depending on country of origin and selection process… but not always.
In Sweden’s Brå register analysis, those born abroad and those born in Sweden to non-native parents are consistently more likely to be registered as suspects than those born in Sweden to two native-born parents.
Brå also reports that being registered as a suspect is ~2½× as common among persons born abroad compared to those born in Sweden to two native-born parents.
Second-generation descendants
Born citizens, free from deportation threat — are often the most overrepresented group in violent crime, gang activity, and sexual offenses.
Sweden (Brå): Across 2007–2018, Brå reports the proportion registered as suspected offenders is highest among those born in Sweden to two non-native parents and lowest among those born in Sweden to two native-born parents, and notes this holds for both men and women.
Sweden (Brå) also shows that when you adjust for age and gender, “excess risk” declines (most for Sweden-born with two non-native parents), but it doesn’t vanish—e.g., for rape, Brå reports relative risk declines from 3.2 → 1.4 for those born in Sweden to two non-native parents, and 3.2 → 2.2 for those born abroad.
Norway (SSB): The report states directly that both immigrants and Norwegian-born persons with 2 immigrant parents are overrepresented as registered offenders, with the overrepresentation highest in the latter group.
Denmark (Justice Ministry): Denmark publishes age-corrected indices, and it is not subtle — male descendants of non-Western origin have an age-corrected criminality index for group violence of 384 (≈ 3.8× expected), while male non-Western immigrants are also overrepresented (index 196).
Denmark (MENAPT memo): The MENAPT memo shows the same pattern in multiple ways, including age-corrected indices (e.g., MENAPT male descendants higher than MENAPT male immigrants) and also indices corrected for age + socioeconomic background, where MENAPT male descendants sit around ~270 across 2016–2023 (i.e., more than 2½× the male population baseline after corrections). (The correcting for SES adjustment is doing a lot of heavy lifting to make migrants look better here too! SES isn’t even a correction you should be doing when you allow unfiltered immigration.)
U.S. vs. Europe: A Critical Caveat
U.S. immigrants are predominantly Latin American (Mexico, Central America, Caribbean, South America). Pew reports 52% of U.S. immigrants were born in Latin America. (R)
European overrepresentation debates are often dominated by MENA / adjacent regions and other non-Western flows, and Denmark’s own “MENAPT” category explicitly includes Middle East/North Africa plus Pakistan and Turkey (with a country list spelled out in the ministry memo).
Spain is a useful “caveat example” of how you can have strong overrepresentation signals by nationality while still needing caution about causal narratives and comparability: Spain’s INE conviction statistics show 72.3% of convicted adults had Spanish nationality in 2023, but the conviction rate per 1,000 was 14.6 for foreign persons vs 5.8 for Spanish nationals (≈ 2.5×). (R)
The caveat: You can’t import magnitudes across countries with different migrant mixes and different recording systems, but wherever descendants are tracked cleanly, the “first-gen advantage” stops being the whole story.
Logical Takeaway
Wherever generation-tagged crime data is published, the pro-immigration narrative collapses:
The “first-gen advantage” is exposed as a temporary, incentive-driven blip.
The long-term, generational crime cost becomes starkly visible—because you can’t launder descendants into a fake “native” sink and pretend the downstream doesn’t exist.
Why doesn’t the U.S. publish similar data?
Because the instant you get generation × status × subgroup cross-tabs at national scale, the “immigrants commit less crime” meme stops being a universal shield and turns back into what it actually is: a narrow, first-gen snapshot.
XII. The Hidden Offense Bundle

The Unseen Crimes: Excluded by Design
When most people hear “crime,” they think murder, assault, theft — the standard, high-visibility offenses.
But immigration brings its own bundle of systematically undercounted, underprosecuted, or administratively downgraded offenses that rarely show up in the headline stats:
Identity/Document Fraud
Fake Social Security numbers, forged driver’s licenses, and fraudulent documentation are often a prerequisite for participation in the economy, yet are rarely prosecuted or tracked as “real crime.”
In many areas, enforcement is non-existent or explicitly deprioritized.
And when it is prosecuted, you can see the mechanism in black and white: DOJ announced 119 illegal aliens prosecuted in Mississippi for identity theft/document fraud and related offenses, including fraudulent use of Americans’ Social Security numbers and unlawful reentry after removal.
Labor Exploitation and Wage Theft
Employers (e.g. second-gen or third-gen immigrants) illegally withholding pay, skimming hours, or abusing the legal vulnerability of first-gen immigrant workers.
These are high-frequency crimes, devastating to communities, but are prosecuted (if at all) as civil violations or labor disputes, not as crimes in the stats.
Human Smuggling and Trafficking
Cartel and organized crime involvement in smuggling people across borders, running stash houses, and engaging in violent enforcement — all of which create enormous social harm, but are often prosecuted in federal silos separate from state/local crime stats.
Treasury’s designation of Tren de Aragua describes exactly this kind of cross-border exploitation: leveraging transnational networks to traffic people (especially migrant women and girls) for sex trafficking and debt bondage. (R)
Cartel/Gang Activity
Organized drug distribution, extortion, and violent turf wars.
These crimes are often distributed across state lines and may be attributed to “domestic” gangs, further hiding the connection to immigration flows.
CRS’s MS-13 report lays out the overlap between local street crime and transnational activity (drug trafficking, human smuggling/trafficking, extortion, murder). (R)
Why Are These Excluded?
Administrative Downgrading: Many of these offenses are counted as regulatory violations or handled quietly via civil penalties.
Data Siloing: Offenses that do result in prosecution are split across separate databases (federal vs. state, immigration vs. criminal).
Political Incentive: Including these would make the spreadsheet—and the narrative—look a lot less favorable.
Bottom line: Ignoring this hidden offense bundle is a deliberate omission to keep “immigrant crime” stats artificially clean. The true social cost is swept off the ledger, out of sight and out of the policy debate.
XIII. What Is Most Likely True?

First-Generation: Lower “Visible” Crime, for Now
If you strip away the PR and just look at incentives, the first-gen story is not mysterious. It’s best-behavior under a sword.
NIJ says it directly:
First-generation immigrants tend to have lower arrest rates than native-born citizens. (R)
That doesn’t prove “immigrant virtue.” It proves what Section III already explained: catastrophic deterrence + extreme downside produces lower visible, police-detectable offending in many measures.
And if you’re dealing with border corridors, that effect can be amplified by an enforcement-saturated environment. The border strategy itself is explicitly framed as “prevention through deterrence” — concentrating personnel, infrastructure, and surveillance to discourage attempts and disrupt activity. (R)
So yes: first-gen can look “clean.” That’s not the end of the story — it’s the beginning of the scam.
Note: Remember the combination of Sanctuary Cities, Underpolicing, Underreporting, Avoidance Behaviors, Judicial Protections, Failure to Note Immigration Status, etc. also make “immigrant crime” appear lower than reality.
Second/Third Generation: Convergence + Laundering
Here’s the part people parroting “immigrants commit less crime” never want to address.
NIJ notes the first-gen pattern diminishes in subsequent generations. (R)
The National Academies’ own summary says the quiet part bluntly: in the second and third generations, crime rates increase and resemble that of the general population of native-born Americans. (R)
Pew goes even sharper: second-generation immigrants “catch up” and resemble native-born Americans in offending profile during the most crime-prone years. (R)
The Pew writeup is based on research by Bersani et al. (2014) which likely underrepresents the actual crime per capita of second-gen immigrants for a variety of reasons.
The study reports second-gen immigrants converge with non-Hispanic Whites, but there is major issue with this claim: selection/collider bias (conditional on being caught, the “White” comparator is not the White population, 2 jurisdiction design/ethnic clustering = huge confounding, not measuring “crime” (arrests/petitions), proxy issues, self-reporting, etc.
That convergence is exactly why “generational laundering” is the foundational fraud. First-gen gets paraded as the “immigrant” data point, and the downstream convergence gets dumped into “native-born American crime.”
Compared to Whites and Asians: the blended “native-born average” is baseline doping
Once you stop comparing to the blended sink and you benchmark against the actual low-baseline reference groups, the headline becomes a rigged frame.
The “native-born average” is not a clean control group. It’s composition-driven, and it’s easily gamed.
So when someone says “immigrants are lower crime than native-born Americans,” what they often mean is:
First-gen looks lower than a blended average we refuse to decompose.
That’s baseline doping and not an apt comparison.
The Reality
So here’s the clean “most likely true” verdict:
First-gen often looks cleaner on visible metrics because deterrence and selection are extreme.
Over time, the effect fades and later generations converge toward native-born patterns.
The meme survives because the U.S. refuses to publish the kill-shot cross-tabs (status × generation × subgroup × enforcement regime), and because the baseline is routinely rigged through blended averages rather than apples-to-apples stratification.
XIV. The Propaganda Playbook

This narrative doesn’t survive by accident. It survives because it’s maintained through a repeatable set of moves that exploit blind spots.
1. Population Swap
Undocumented → noncitizen → immigrant → foreign-born.
Widen the category until the number looks clean, then pretend that answers the question everyone was actually asking.
Subgroup blender: Average high-skill legal immigrants with low-skill/illegal cohorts, refuse to break out visa/education/origin, then declare the diluted mean is “the truth.”
2. Metric Swap
Geographic stacking: Use immigrant-heavy states/metros with decriminalization + non-cooperation + de-policing to generate cleaner recorded stats, then treat those stats as a universal national truth.
Crime → arrests → convictions → incarceration → “self-report.”
Pick the stage of the pipeline that flatters the story. Each step is filtered through enforcement, prosecution, diversion, and removals.
3. Baseline Fraud
Compare first-gen immigrants to the blended “native-born average” instead of the only honest baselines: sex/age standardized + race-stratified comparisons (and benchmark to whites and Asians as reference groups).
4. Generational Amnesia
Freeze the analysis at first-gen, then dump the kids and grandkids into “native-born crime,” so downstream convergence never shows up as “immigration impact.”
5. Make the Variable Not Exist
If the status variable isn’t recorded nationally, you can talk with certainty forever because the claim can’t be audited.
6. Moralize Incentives
Recast deterrence/self-policing as “virtue,” then shame anyone who demands the obvious: generation-tagged, status-tagged, apples-to-apples baselines.
XV. Questioning the Claims (Critical Thinking)

Forget the headlines and the carefully-massaged talking points.
If you want to know whether a claim about immigrant crime is honest or fraudulent, run it through this checklist.
1. Which group?
Are we talking about undocumented? Legal permanent residents? Temporary visa holders? Foreign-born overall? What’s the country/region of origin?
If they won’t specify the population precisely, they’re already doing the category swap.
What selection channel?
Visa type + education level + origin. If they’re averaging PhDs/H-1Bs with low-skill and illegal flows, the “immigrant crime rate” is contaminated by design.
2. Which metric?
Is it reported crime, arrests, convictions, incarceration, or victimization surveys— and why did they choose that stage of the pipeline?
Every stage filters reality through enforcement, prosecution, plea deals, diversion, and removals.
3. What controls?
Are age and sex controlled for?
Are years-in-country and age-at-arrival controlled for? If not, you’re comparing different exposure windows, not propensities.
4. What baseline?
Are they comparing to the blended “native-born average” (the statistical sink), or are they doing the only honest thing:
Sex/age standardization → race-stratified comparisons → then the real low-baseline comparators?
If they’re using the blended native-born baseline, it’s baseline doping.
5. Which generation?
Are second-, third-, and fourth-generation descendants tracked separately — or dumped into the “American” column where the costs disappear?
If descendants aren’t split out, you’re watching the generational laundering scam in action.
6. Does the dataset even contain immigration status?
This is where the con often dies instantly.
NIBRS (the FBI’s main incident-based system) does not collect citizenship status of offenders or victims.
So if they’re speaking with certainty about “undocumented crime rates” nationally, ask one question:
Where did that status variable come from?
7. How are “unknowns” handled?
Do they ignore missingness? Impute it? Pretend it’s random?
Even NIJ notes most prior immigrant-crime research has been unable to separate undocumented from documented, which forces fake “uniform immigrant” bins in a lot of studies.
8. What enforcement regime?
Is this a border corridor (enforcement-saturated deterrence environment) or an interior sanctuary metro (status-blind, non-cooperation, de-policing incentives)?
CRS describes sanctuary policy structures (“don’t enforce / don’t ask / don’t tell”). If they pretend enforcement regimes don’t matter, they’re laundering measurement effects into “behavior.”
If these questions aren’t answered it’s mostly trash that the left-wing faction will parrot like a Dunning-Kruger everywhere thinking they are smart and you’re a moron.
Final Take: The Manufactured Mirage
The American public is being subjected to a deliberate, institutional gaslighting campaign — one that survives not by producing honest data, but by avoiding it at all costs.
The “immigrants commit less crime” narrative is a statistical con.
It survives through a combination of:
Generational laundering (first-gen looks clean; descendants get booked as “American crime”)
Baseline fraud (comparing to a blended native-born sink instead of age/sex-matched, race-stratified baselines)
Status-blind national data (the key variable isn’t even in the main crime pipeline)
Metric laundering (crime → arrests → convictions → incarceration, whichever flatters the story)
Policy-engineered “declines” (reclassification, downgrading, de-policing, non-cooperation)
Border vs interior distortions (enforcement-saturated deterrence environments vs status-blind sanctuary metros)
Every honest, adult conclusion about this topic converges to the same place:
First-gen “good stats” are a temporary product of deterrence and selection, not a permanent moral trait.
Second and third generations converge upward toward native-born baselines—so the “immigrant advantage” gets front-loaded while downstream costs vanish into the “native-born” column.
Once you benchmark against the real low-baseline comparators (whites as the majority reference, Asians as the floor benchmark), the blended “native-born average” comparison is exposed as a rigged frame.
True transparency (generation-tagged, status-tagged, apples-to-apples baselines) would destroy the narrative overnight. The fact that the U.S. won’t produce those cross-tabs at national scale is the whole story.
Until the entire stack (definitions, data, baselines, enforcement regimes) is forcibly opened to scrutiny, the myth will endure.
Every journalist, academic, politician, and “fact-checker” who repeats it as a clean national truth is pushing propaganda.
Note: You can use much of the logic in this write-up to critically analyze the “immigrants boost GDP” claim as well. The “GDP boost” is not what you think outside of skilled and necessary groups.