
Why AI and Automation Destroy the Case for Mass Immigration
Cheap labor suppresses productivity, the fiscal math is devastating, the gaps don't close, and the political damage is already locked in.

The economic argument for unfiltered immigration was always bad. It was built on stylized models from left-wing academics, marketed to credentialed liberals as “evidence,” and absorbed uncritically by an entire class of woke PhDs and MDs who eat “best evidence” slop buffets for breakfast and never bother to check if the meal was poisoned.
One-shotted by a peer-reviewed “model” and now set in stone within their psyches.
These are the people who are genuinely confused about why Canada’s GDP per capita has been declining for years — the worst 5-year decline since the Great Depression — despite decades of “skilled immigration to boost GDP” and “social democracy.”
These same people cannot understand why test scores are dropping in developed countries despite asinine levels of spending on public education; they’ve banned reality anytime it doesn’t fit the consensus egalitarian fantasy.
The Fraser Institute explicitly identified mass immigration as a primary cause: high volumes of immigrants lowered labor costs and suppressed business investment in capital and technology. Canada fell below the OECD average for the first time in recorded history in 2024, its World Happiness ranking collapsed from 5th to 18th, and the U.S. now produces nearly 50% more per person — a gap unprecedented since 1945. The model failed. The modelers won’t admit it.

They classify “immigrants” as a monolith and cite aggregate statistics that wash out every meaningful distinction.
Which specific immigrants? From where? With what skills? At what fiscal cost? How will they vote? How will their children perform?
Most Western countries do not systematically track lifetime fiscal net present value, crime rates, assimilation rates, or intergenerational outcomes by race, ethnicity, country of origin, IQ, or skill level.
When the UK’s ONS was asked directly via FOI for crime data by nationality, the answer was: “we do not hold the information you have requested.” The Home Office admitted its data isn’t reliable.
Denmark is virtually the only Western country that collects conviction data by origin — and 40+ nationalities exceed the Danish rate for violent crime.1
Conservatives were dismissed for decades as “racists” and “nativist rubes” for resisting this. They often couldn’t articulate why and didn’t have the studies, models, or academic vocabulary the credentialed class demands. But the instinct was directionally right, and it may have unironically prevented a bigger disaster than we currently have.
Every year populist resistance slowed the open-borders agenda was a year the damage was contained.
Credentialed models failed and are still failing (see the CATO Institute, whose immigration “research” is functionally indistinguishable from left-wing open borders advocacy); institutional reps remain deliberately obtuse for a paycheck without considering cascading multi-generational effects or acknowledging that their models are essentially a house of cards.
Nobody serious about ensuring the U.S. stays dominant is against elite world-class-skilled immigration — that has always been a win-win.
But only ~15% of legal permanent residents enter through employment-based categories — and of this subset many are not really much more skilled than Americans (they are often just cheaper labor, using highly questionable/fake credentials, or have credentials that are much lower quality than the U.S.).
Perhaps the most damage is done when a “skilled” immigrant leverages his/her skill to advocate for policies that disrupt the foundational principles of the U.S. (e.g. a lawyer who fights hard for open borders, freeing criminals, and importing more of their ethnic group).
The remaining ~85% is chain migration selecting for kinship, not skills.
Add 1-2+ million unauthorized entries per year with zero skills filter, and the ratio of skills-selected to non-skills-selected is roughly 1:6 or worse. Even within the “skilled” category, H-1B workers earn 16% less than comparable natives — it’s a wage-arbitrage pipeline, not a genius-recruitment program.2
And even for genuinely elite talent, the assumption that admission requires a pathway to citizenship and voting rights is a policy choice, not a necessity. The UAE and Singapore host millions of skilled expatriates without citizenship. Many top talent would live in the U.S. either way — they want American markets and quality of life, not a ballot.
I’m not arguing against helping other countries.
I’m arguing that the U.S. cannot help anyone from a position of self-inflicted decline.
If we let the country become overwhelmed by leftism (handouts, degrowth, socialism, ethnic tribes without assimilation), we can’t help anyone — and before we realize it, we can’t even help ourselves.
Have a look at South Africa. Preservation isn’t selfishness. It’s a prerequisite for generosity.
Here’s what reality says.
Cheap Labor Is the Enemy of Productivity

In 2007, a New York dairy farmer named Dale Hemminger had a worker arrested by immigration authorities. He installed robotic milking machines.
His farm went from 800,000 pounds of milk per worker per year to 2.5 million — a 3x productivity gain. His remaining workers earn more, work shorter hours, and do less grueling labor. The New York Times column that profiled him presented this as a vision of the future — then argued we should preserve the conditions that prevent it. Daniel Kishi’s rebuttal dismantled that framing point by point.
This isn’t an anecdote.
Mann & Pozzoli (2024), in a study published in the Journal of Economic Behavior & Organization, exploited a natural experiment in Denmark where refugees were quasi-randomly assigned to municipalities, proving the mechanism causally: a one percentage point increase in the share of non-Western migrants decreased firm-level robot adoption by 7% and robot import values by 15%.3
More immigrants → lower wages → less incentive to automate.
About 25% of dairy farms in Denmark and the Netherlands use automated milking systems. In the U.S., roughly 5%. Lely commercialized the first system in 1992. The gap isn’t technology — it’s incentives. H-2A visas exploded from ~50,000 in 2005 to 385,000+, making mechanization economically irrational.
Florida shows the first phase. After mandating E-Verify in mid-2023, average real wages rose 6.4% in 32 months. Prior 32 months? Down 3.0%. Pre-COVID to passage? Flat. That's the labor market repricing — employers paying more for a tighter labor pool. It doesn't yet prove productivity gains; those come in step two, when higher labor costs trigger capital investment, which takes years.
Denmark and Hemminger show what phase two looks like: 3x output per worker, fewer employees doing less grueling work for more money. Florida is the wage signal. The automation payoff comes next — if policy holds.
Automation isn’t a fallback — it’s the superior long-term path regardless.
Robots don’t need healthcare, collect benefits, commit crimes, vote, require schools, and reshape the culture.
They get cheaper every year.
The current high cost reflects a 5% adoption market — scale it up and costs collapse like solar, semiconductors, and every other mass-deployed technology.4
Cheap labor didn’t just delay this transition. It actively prevented it and every year of delay is lost productivity compounding against the national interest.
The Fiscal Math Is Predictable — and Devastating
A chart from Jonatan Pallesen, drawing on Dutch fiscal data from van de Beek et al. and national IQ estimates from Parra & Kirkegaard (2025), plots lifetime net fiscal contribution per person by immigrant origin group in the Netherlands.
The R² is 0.65. Origin-country average IQ alone explains two-thirds of the variance.
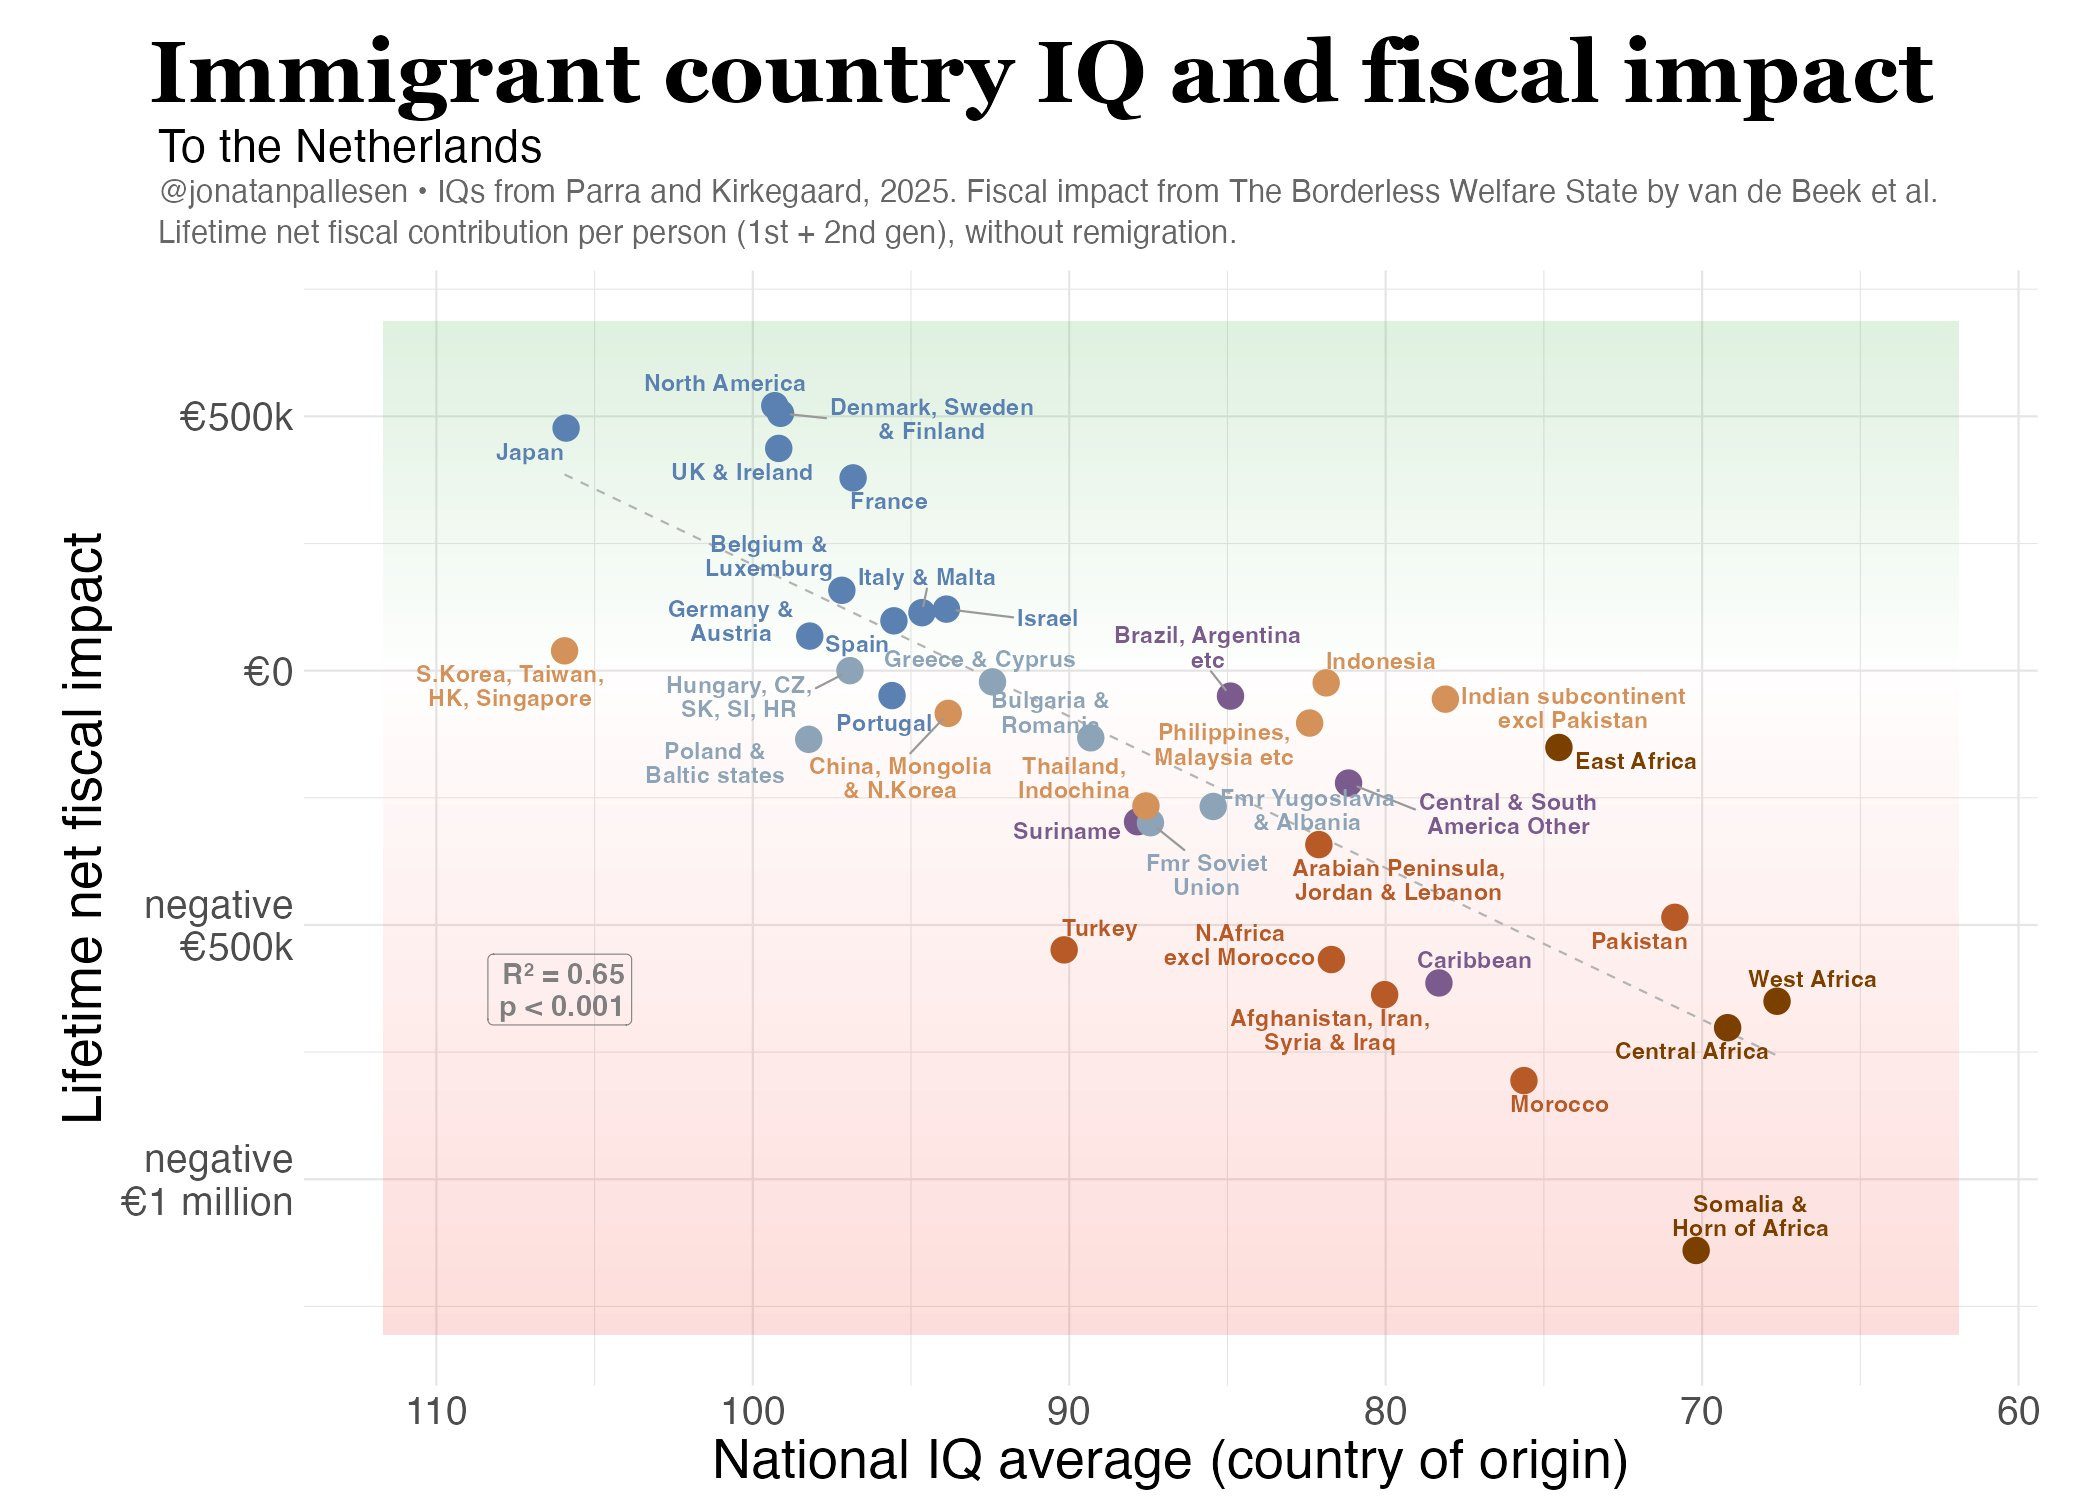
Immigrants from North America, Japan, and Northern Europe are net positives in the €400-500K range.
Immigrants from the Middle East, North Africa, and sub-Saharan Africa approach negative 1 million euros per person over a lifetime including the second generation.
The NAS 2017 report found the same in U.S. data: immigrants without a high school diploma are net negatives of -$115K to -$170K+ per person.5
This almost certainly understates the true cost, since the model doesn't fully capture displacement effects on native workers, automation suppression, state/local overhead, charity costs, or the downstream fiscal burden of second and third generation outcomes.
The distribution is the key: short-term benefits concentrated among employers who access cheaper labor, diffuse costs spread across the native population — heaviest on the least advantaged Americans.
But even the employers lose long-term: the political transformation they helped enable through cheap-labor dependence produces higher taxes, heavier regulation, and institutional decay that eventually makes their own businesses unviable.
A regressive transfer dressed up as humanitarianism.
Gaps Don’t Close
If these trajectories were temporary and immigrant-origin populations converged to the host-country mean — the picture would be less alarming.
A century of data says they don’t.
Jensen & Kirkegaard (2025), meta-analyzing 139 U.S. studies from 1918-2017 (N ≈ 400,000), found the Black-White IQ gap essentially unchanged for 99 years: -17.04 at the start, -17.06 at the end.
Across a century of radical environmental change: end of Jim Crow, desegregation, affirmative action, Head Start, massive spending increases — the gap didn’t move.
Publication bias deflates it; correcting for it makes it larger.6
The Hispanic-White gap (-9.9 points) shows apparent narrowing, but this likely reflects compositional changes in who identifies as Hispanic, not convergence; 2025 SAT data shows the same distributions at the same magnitudes as every prior year.
Crémieux’s analysis of Jewish IQ — meta-analytic mean ~110 for Ashkenazi Americans, stable across a century — demonstrates that group cognitive advantages are equally real, persistent, and productive.
The symmetry is the point.
If advantages persist and produce superior outcomes, deficits persist and produce inferior outcomes — including the fiscal trajectories documented by van de Beek.
Telles and Ortiz tracked Mexican-American families across four generations and found persistent gaps in education and income into the fourth generation. The “convergence” that would make the fiscal math self-correcting isn’t happening.7
Transformation Is Already Locked In
The fertility differential seals it.
Non-Hispanic white TFR is ~1.5. Hispanic TFR is ~1.9-2.0. Non-Hispanic whites went from ~80% of births in the 1990s to ~50% today.

Meanwhile native workers at the bottom — disproportionately Black and Hispanic Americans — are being displaced and squeezed by 3-8% wage depression from immigration-induced supply increases.
The primary domestic victims of mass low-skill immigration are the most vulnerable Americans.
Social trust collapses alongside the labor market. Robert Putnam — Harvard, liberal — conducted the largest study ever on civic engagement: 30,000 people, 41 communities.
He delayed publication for years because the results horrified him.
Greater ethnic diversity → less trust of neighbors of any race, including one’s own.
Less volunteering, less charity, fewer friends.
People “hunker down like turtles.” Negative in 39 of 41 communities. Trust halved in the most diverse settings.8
The new demographic majority doesn't just change what the electorate wants.
Different populations carry different distributions of political preferences, time orientation, trust, individualism, and attitudes toward government. As these populations grow as a share of voters, both parties reshape themselves to compete for them — and both move in directions away from what made the already-successful country successful.
How is that playing out with the Hispanic demographics?
The left gets more redistributionist as immigrant-origin voters who favor larger government and more handouts (at ~75-25 margins) grow the coalition.
The right gets more populist and fiscally liberal as working-class Whites react with cultural protectionism and Hispanic Republicans demand strong-arm social conservatism, bigger gov, and more handouts for their causes.
The old consensus around limited government and fiscal restraint loses its electoral constituency as the population that built it shrinks.
California is the proof of concept.
Mostly White and a Republican lock in the past.
Now? Mostly Hispanic and a leftist uniparty with the worst inequality, homelessness, and middle-class flight in the nation.
The politics, fiscal trajectory, and institutional quality followed the demographic transformation predictably.

The Timing Trap
We are at the exact moment where AI and robotics could let the U.S. do more with fewer workers and build the most productive economy in history.
Easterly & Kraay showed across 157 countries that small states are 50% richer per capita than regional neighbors — a productivity advantage, not a scale advantage.
Population quantity doesn’t drive prosperity. Population quality does.
But the window narrows every year. Every year of the current trajectory adds fiscal liabilities that persist for generations, suppresses automation investment, and dilutes the institutional base.
The left currently holds two positions simultaneously: (1) AI and robots will take most jobs within 5-10 years, and (2) we need more immigrants.
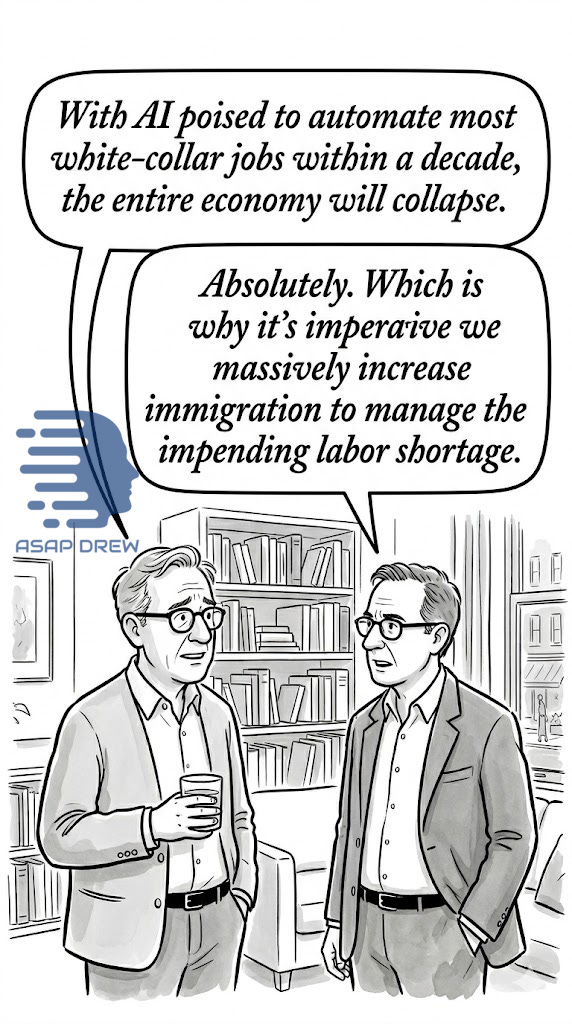
Make it make sense. Banning AI and adding more immigrants is a surefire way to destroy the country and cede global power to competitors with common sense.
If you want what’s best for the United States and humanity, you should be (A) pro-AI/automation, (B) anti-unfiltered immigration, (C) pro-elite, actually skilled, and actually necessary immigration (not some cookie cutter STEM/H1b scheme).
And currently we need a moratorium on most immigration to digest/assimilate the sheer quantity that entered under Biden; this may take a while.
The economic argument was “who will do the work?” AI and robots are answering that. The fiscal argument was always negative. The convergence hasn’t happened in 99 years. The political transformation is well underway.
We are importing the costs, delaying the technology, and locking in the politics — all at once. The automation revolution offers an off-ramp.
The question is whether we take it before the exit is behind us.
When you disaggregate crime data where it exists, the picture inverts sharply from the “immigrants have lower crime” aggregate claim. I’ve already discussed why it’s misleading in “Do Immigrants Commit Less Crime in the U.S.?” A 2025 UK analysis found non-British citizens 3.5x more likely to be arrested for sexual offenses, with Afghans and Eritreans over 20x more likely than British citizens. Sweden found 47.8% of convicted rapists were foreign-born, with MENA nationals the largest share. Denmark’s data, the most granular in Europe, shows Somalis, Lebanese, Jordanians, and others at multiples of the native conviction rate. The aggregate “immigrants have lower crime” statistic washes all of this out — by design.
The gap between “skilled immigration” as marketed and as practiced is enormous. A significant share of H-1B usage is concentrated in outsourcing firms — Infosys, Tata, Wipro — that use the visa to replace American workers with cheaper foreign labor, not to recruit irreplaceable talent. Even when the skill is genuine, many “skilled” positions are saturated domestically or the foreign credentials are inflated. The question nobody asks: how many of these immigrants are actually driving innovation vs. simply arbitraging the wage gap?
The IZA working paper has the full methodological detail. Denmark’s refugee Spatial Dispersal Policy (1986-1998) assigned refugees quasi-randomly to municipalities regardless of immigrant characteristics or local economic conditions, providing an unusually clean natural experiment. The shift-share instrument uses 1993 geographic distribution, well before widespread robot adoption. The substitution relationship also held for first-time adopters, low-skilled immigrants specifically, and production workers — confirming the mechanism isn’t just correlation.
The cost objection contains its own refutation. Current agricultural robotics prices reflect a 5% U.S. adoption rate. If adoption moved toward Northern European levels, economies of scale would collapse unit costs — the same pattern as solar panels, semiconductors, GPS, and every mass-deployed technology in history. The self-reinforcing trap: cheap labor eliminates demand → low production volumes → high unit costs → cheap labor looks rational → repeat. Restriction breaks the cycle. When you run payback math at scale — factoring in eliminated labor costs, increased output, reduced turnover and regulatory risk, and annually improving technology — mid-to-large operations pencil out in under five years. The libertarian Bastiat objection (isn’t forced automation just redirecting capital?) was rebutted by Kishi: the distortion already exists. Removing a subsidy isn’t breaking a window — it’s unboarding one that’s been nailed shut for forty years.
The “undocumented immigrants can’t access benefits” talking point is “legally” true at the individual federal level and wildly misleading at the household level. Roughly 60-65% of households headed by an unauthorized immigrant use at least one major welfare program through U.S.-citizen children who qualify for Medicaid, SNAP, WIC, and free school meals. Add off-the-books employment generating zero tax revenue, SSN fraud externalities (the SSA’s Earnings Suspense File holds hundreds of billions in contributions that will never be claimed), uninsured driving costs, healthcare use, translation, displaced American workers, and census-based apportionment shifting House seats — the aggregate hasn’t been properly tallied.
The gaps are age-consistent from ages 2 to 60, survive SES controls within groups, and appear identically in selective (national SAT) and representative (Michigan, where all students take the SAT) samples. Crémieux Recueil’s 2025 SAT analysis confirms the same distributions every year. The Asian trend (+0.73/decade) similarly reflects post-1965 immigration shifting the Asian-American population toward high-human-capital East/South Asian origins, not convergence. Jewish Americans remain at +6.1 relative to whites, stable, no trend.
Telles, E. & Ortiz, V. (2008), Generations of Exclusion: Mexican Americans, Assimilation, and Race, Russell Sage Foundation. Third-generation Mexican Americans — the largest and best-studied Hispanic subgroup — show educational gains over immigrant grandparents but plateau at or below the national average. Intergenerational mobility data from Chetty’s Opportunity Atlas confirms: Hispanic upward mobility is real but modest, and it plateaus well below the White mean by the third generation. The “native-born” reclassification compounds the illusion — children of unauthorized immigrants are citizens by birthright and classified as “native-born” in all subsequent statistics, making it look like “Americans” are declining when what’s actually happening is compositional change.
Putnam — who is not remotely conservative — found that even after controlling for income inequality and crime rates, diversity still predicted lower trust. In diverse San Francisco and LA, about 30% said they trust neighbors a lot. In homogeneous communities in the Dakotas, 70-80%. Putnam optimistically argued the effect was temporary. The evidence hasn’t supported that — Japan, Finland, Denmark, and other homogeneous countries maintain exceptionally high social trust, while nations with long histories of diversity remain low on trust metrics. He told the Financial Times he delayed publishing because “it would have been irresponsible to publish without” developing proposals to offset the negatives — an extraordinary admission that he withheld data until he could frame it palatably. Academics aren’t supposed to do that.