
Murder Is Down. "Record Low Crime" Isn't What You Think.
We are measuring 1929 street crimes while the economy is looted through fiber optic cables.

I recently read: “Record Low Crime Rates are Real, Not Just Reporting Bias or Improved Medical Care” on AstralCodexTen and am adding my 2 cents.
The claim that American crime rates have plunged to historic (even 250-year) lows has become conventional wisdom. I don’t think many dispute the idea that homicides are massively down relative to historic estimates.
But the extension to “all crime” is probably overstated — perhaps to a significant degree. A legitimate decline in “lethal violence” might be glossing over: (1) a broken measurement apparatus, (2) an explosion of unmeasured criminal victimization, and (3) a society that has adapted to danger rather than eliminating it.
Crime has three ledgers, and “historic lows” only refers to one of them.
Ledger 1: Legacy street crime. Homicide, robbery, burglary, etc. Measured by police reports and partly by the NCVS.
Ledger 2: Modern predation. Fraud, cyber, identity theft, check fraud, business email compromise, ransomware. Measured through complaints, financial systems, and private security — not UCR headlines.
Ledger 3: Administrative and underground-economy crime: Tax evasion, benefits fraud, document/ID fraud, immigration offenses, off-the-books labor.
It is completely possible for Ledger 1 to improve while Ledgers 2 and 3 explode. “Crime is at historic lows” is a claim about Ledger 1 only, and even there, the pipeline is noisier than most people admit.
One more ledger that never shows up in “crime is down” headlines: drug poisoning. In 2024, the U.S. recorded 79,384 overdose deaths — mass lethal harm downstream of an illegal market; yet it’s rarely counted as “crime” in the way people mean when they say “historic lows.”
Homicide really did fall. No denying it.
The FBI’s 2024 murder rate of 5.0 per 100,000 is a legit substantial decline from the pandemic peak of 6.8 in 2020 and the early-1990s peak of ~9.8.
Homicide is the hardest crime to undercount; bodies generate independent records through medical examiners, and clearance rates remain far higher than for other offenses.1
The decline is corroborated internationally: the UK, Germany, and Australia all show parallel drops, and a 166-country study found common crime declining across Europe, Australasia, and most of Asia from 2006–2019 (van Dijk, Nieuwbeerta & Joudo Larsen, 2021). Something genuinely structural is occurring, not merely a U.S. statistical artifact — and we should acknowledge it.
A few precision caveats on “250-year-low" claims, none of which undermine the directional story.
The 20-year low in the FBI’s own published data is 4.4 in 2014, not 2024. The estimated ~4.0 rate for 2025 comes from the Council on Criminal Justice — a reputable source tracking ~35 large cities that showed a 21% homicide decline — but it remains an extrapolation to the nation, not a published national statistic.
The overall trajectory is downward and may well reach a modern-era record. As for the “250-year low” comparison: the leading historian of pre-modern American homicide, Randolph Roth, has spent decades assembling the Historical Violence Database from court records, newspapers, and coroner files.
His data actually shows periods (particularly stable Northern communities in the mid-18th and early 19th centuries) with rates that may have been comparably low. But the coverage is geographically patchy and drawn from small, unrepresentative communities; you cannot make a confident national statement before systematic collection began in 1928.
The “250-year low” claim may ultimately prove correct, but it rests on data that doesn’t yet support the precision it implies. “Lowest in the modern era” is solidly defensible.
Murder declining does not mean all crime declined.
Nonfatal violence is higher
Homicide is one subset of one ledger. You can have murders down while assaults rise.
You can have “legacy street crime” down while fraud, identity theft, administrative looting, and underground-economy illegality explode. The inference “murders are low, therefore crime is low” only works if the measurement system covers the main harm channels but it doesn’t.
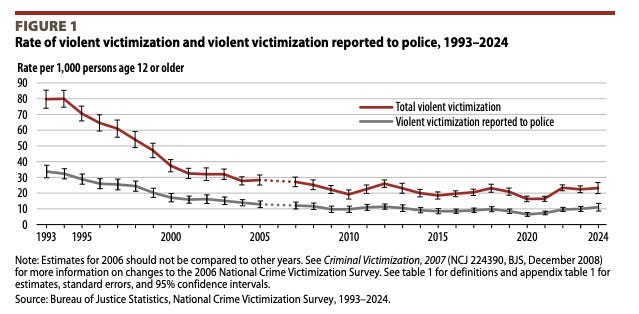
For nonfatal violence, the government’s own National Crime Victimization Survey shows 2024 rates higher than both 2015 and 2020.
Urban violent victimization is up 61% since 2019 (34.0 vs. 21.1 per 1,000). Youth (12–17) victimization surged 37% in a single year (2023–2024).
To be fair: NCVS violent victimization remains well below the early 1990s peak; the long-run decline is notable.
But the NCVS does not show “historic lows” for nonfatal violence; it shows post-2019 increases, particularly in cities and among young people, that the “all crime is collapsing” narrative simply ignores.
Factors that drove the crime rate down
Before highlighting what the statistics completely miss, it is worth noting some of the forces that have likely contributed to lower crime.
The dominant drivers likely differ by era (the factors that ended the 1990s crises may not be the same as those driving the decline in 2025, but there’s overlap and maintenance effects).
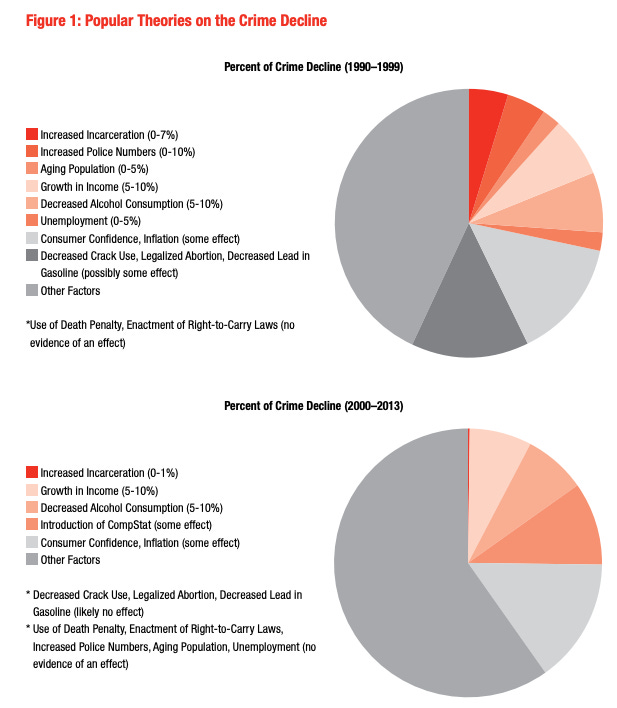
The 1990s crash (murder rate ~9.8 → ~5.5)
End of the crack epidemic: Crack markets stabilized and the territorial violence around them subsided. Widely considered the single largest driver of the 1990s homicide drop.
Policing innovations: CompStat (1994), hot-spots policing, and early precision targeting coincided with large drops in adopting cities. Levitt (2004) ranks increased police numbers among the top factors. The international crime drop in countries without these innovations complicates causal attribution, but the U.S.-specific evidence is strong.
Mass incarceration: The prison population rose from ~300,000 (1980) to over 2.1 million at peak. The Brennan Center estimates incarceration explains ~5% of the 1990s decline; Levitt (2004) estimated ~12%. The mechanical effect on chronic offenders (a small population responsible for most crime) was substantial. The effect is thought to have diminished sharply after 2000.
Abortion legalization: Donohue & Levitt (2020) estimated legalized abortion reduced violent crime by 47% from 1991–2014, with the effect strengthening in out-of-sample data. The 2020 replication with 17 additional years gave it renewed empirical weight, but the identification strategy remains contested (Joyce 2006; Foote & Goetz 2008).2
Early background factors: Declining alcohol consumption (down ~20% since the early 1980s) and the beginning of a broad expansion in mental health treatment access.
The 2000s–2010s grind (murder rate ~5.5 → 4.4 in 2014)
With crack and incarceration having done their heaviest lifting, a different set of forces took over: overwhelmingly (1) opportunity-reduction and (2) behavioral — rather than criminal justice.
Security and target hardening (strongest for property crime): This is arguably the most underappreciated top-tier driver, especially for the broad property crime drop. Vehicle immobilizers and electronic security cut auto theft dramatically. Farrell et al. (2014) argue the “security hypothesis” is the single explanation that passes standardized cross-national tests. Household security followed a similar trajectory: alarm systems, deadbolts, controlled-access housing. The Community Associations Institute estimates ~369,000 homeowner associations covering ~77 million residents (~33.6% of U.S. housing); much of it in planned or gated communities with cameras, controlled access, and contracted security. Private security outnumbers sworn law enforcement nearly 2-to-1 (1.2 million guards vs. fewer than 700,000 police officers). By the 2020s, 20% of U.S. internet households had video doorbells (up from 4% in 2017), adding a layer of private surveillance that raises identification risk for offenders. This is a real reduction in successful crime, but it’s a society buying down its crime rate through massive private investment, not one that has eliminated criminal motivation.
Reduced exposure (the umbrella mechanism): Routine activities theory (Cohen & Felson, 1979) holds that crime requires the convergence of a motivated offender, a suitable target, and the absence of a capable guardian. Multiple forces converged to keep people (especially young men) out of high-risk public space.
Screen time exploded from minimal internet use to 7+ hours daily on devices; Cunningham, Engelstätter & Ward (2016) found violent video game releases associated with decreases in violent crime, consistent with an incapacitation effect.
Youth alcohol use collapsed: Monitoring the Future reports 12th-grader past-year drinking fell from 75% (1997) to 42% (2024), and ~35% of violent victimizations historically involved an offender who’d been drinking; fewer intoxicated young men in public mechanically reduces violence.
More young adults are living with parents; Pew reports roughly 1 in 3 adults ages 18–34 as of 2021, meaning less unsupervised nightlife exposure and more informal guardianship. These are all sub-channels of one mechanism: less time in the places where crime happens.
Demographic aging: Median age rose from 35 (2000) to 38 (2019), continuing to shrink the crime-prone young male cohort.3
Background factors (plausible but lower confidence as macro drivers)
Fitness culture: Gym memberships rose from 32.8M (2000) to 64.2M (2019), and meta-analyses find exercise reduces aggression (g = −0.53); directionally plausible but hard to quantify at population scale.
Obesity: Doubling from ~23% to ~40% may have a counterintuitive incapacitation effect (Kalist & Siahaan, 2013).
Mental health treatment expansion: ~11.4% of adults on antidepressants by the 2010s, 1 in 5 receiving treatment correlates with the decline, but the best individual-level evidence from Fazel et al. (2015) and ~856K Swedish SSRI users found SSRIs linked to a modest increase in violent crime (HR=1.19), so the mechanism is unclear; broader treatment access may help via clinical contact and psychosis management rather than via medication effects.
Sustained economic expansion and low unemployment contributed as background conditions.
The 2020–2025 spike and recovery (murder rate 4.4 → 6.8 → ~4.0)
The pandemic years are the most revealing. Homicide spiked ~30% in 2020 (the largest single-year increase ever recorded) driven by COVID disruptions, the post-Floyd police pullback, and the collapse of community supervision and courts.
The fact that the spike reversed almost as fast (2022–2025), tells us the post-2020 decline is substantially a reversion to trend after a disruption, not new structural improvement. What sustained and deepened the recovery?
Routine activities normalization + remote work: As lockdowns ended, the opportunity structure for crime partially normalized, but remote work persisted for tens of millions, permanently reducing street exposure. McConnell (2024) finds WFH is associated with reduced burglary, consistent with a “guardian at home” effect. This is primarily a property crime mechanism; the homicide effect is less direct.
Focused deterrence: NYPD’s precision zones produced a 40% decline in shootings in 2025 — a strong case study, though one city’s results should not be extrapolated into a national causal claim. More broadly, cities that adopted focused deterrence strategies targeting high-risk groups saw the fastest recoveries.
Continued time-use absorption: Fitness memberships surged to a record 77 million (2024); up 20% from pre-pandemic. And screen time continued absorbing idle hours. These are maintenance forces keeping the floor low.
Demographic momentum: Median age hit 39 in 2025. The aging effect is slow but cumulative and never reverses.
The factors driving today’s numbers are overwhelmingly time-use and behavioral, not the criminal justice levers that dominated the 1990s.
A caveat on “lead”: While individual studies estimated a 7–28% crime reduction from leaded gasoline phaseout, the first meta-analysis of the lead-crime literature (Higney, Hanley & Moro, 2022) found significant publication bias across 542 estimates from 24 studies, with the pooled partial correlation falling to r = 0.16 after adjustment, and further standard corrections push the estimate toward zero. The cross-national correlation is suggestive, but the causal estimate appears substantially inflated by selective reporting.
These are legitimate anti-crime forces.
The question is whether the remaining decline (the gap between what these factors predict and what the statistics show) — is real or partly an artifact of the broken measurement pipeline.
Blind spots in measuring crime; official stats may be misleading
The FBI’s crime data suffered a major comparability break during the 2021–2022 NIBRS transition, when population coverage cratered from ~95% to ~65%.
Coverage has recovered to 95.6% for 2024, but that rapid improvement itself complicates trend comparisons across the early 2020s, since the system is increasingly comparing estimates derived from very different coverage bases and modeling assumptions.
And as of mid-2024, the 5 most populous states combined sat at just ~48% participation (by CRS’s measure), meaning national estimates still depend far more on statistical imputation than analysts acknowledge.
Beyond coverage gaps, there are documented cases of agencies systematically manipulating their own data, and these continue into the present:
DC Metropolitan Police (2025): A draft DOJ review found a “culture of coercive fear” under Chief Smith led to systematic misclassification. Both DOJ and Congress opened investigations. The DC police union chief publicly challenged the accuracy of reported statistics — the same data showing violent crime “down 35%” and used to argue against federal intervention.
LAPD (2005–2012): LA Times found ~14,000 aggravated assaults misclassified as minor incidents, lowering reported violent crime by 7%.
Chicago PD (2013): Chicago Magazine uncovered murders reclassified as non-criminal deaths, with officers describing pressure to use “magic ink” that made cases disappear.
NYPD (2010–2012): Officer Schoolcraft recorded supervisors ordering officers to refuse reports and recode felonies. An internal report confirmed the manipulation.
Wisconsin (statewide audit): A DOJ review of sexual assault reporting found only ~67% of incidents were correctly classified for UCR — meaning a third of sex offenses were being miscategorized or unreported to the federal system.
Austin PD: A Texas DPS audit found the department improperly cleared rape/sexual assault cases using “exceptional clearance” designations, artificially inflating closure rates.
Note: These aren’t “random anecdotes”; they are the detected subset a.k.a. the small fraction of jurisdictions where audits, whistleblowers, lawsuits, or media scrutiny forced the issue into daylight. Most departments are never audited at this depth so the correct takeaway isn’t “rare” but “we don’t really bother measuring it.”
These span 6 jurisdictions across 2 decades: America’s 3 largest police departments, the nation’s capital, a statewide audit, and a state DPS investigation.
The incentive structure: political pressure to show declining crime, CompStat-style metrics, career advancement tied to numbers — is not incidental; it is structural.
NIJ-published research on police performance measurement explicitly discusses how systems designed to reward crime reductions can distort recording incentives.
The UK has the same problem: the Office for National Statistics stripped police-recorded crime of its "National Statistics" designation in 2014 over recording practice concerns. A House of Commons committee found accumulating evidence that the underlying recording practices were unreliable; some of this is deliberate manipulation, some is training and classification complexity. Either way, it breaks comparability over time. The vast majority of misclassification, downgrading, and refusal to take reports is never audited. We only see the visible portion of the iceberg.
The 2 main US data systems increasingly contradict each other.
In 2022, the FBI reported violent crime down 2% while the NCVS showed serious violent victimization up 75%. The driver: reporting to police dropped from 52% to 48%. Property crime reporting has collapsed to just 31%; meaning police see fewer than one in three property victimizations.
Even motor vehicle theft (supposedly the “clean” category where everyone reports for insurance), only reaches about 75% reporting in the NCVS, not the ~100% commonly assumed.
The NCVS (the government's check on police-reported statistics) has its own growing blind spots: BJS reports household completion rates of ~60%, down from historical norms (~80-90%), raising questions about whether the hardest-to-reach populations (transient, undocumented, high-crime neighborhoods) are adequately sampled.
The math on reporting alone: if violent crime reporting drops from 50% to 42% with actual victimization constant, official statistics show an apparent 16% decline that is entirely illusory. Even motor vehicle theft sends contradictory signals between systems: FBI shows it down 19.4% while NCVS shows it up 47% since 2020.
Enforcement withdrawal and the three-pronged effect
Total US arrests fell roughly 25% from 2006 to 2022. California’s total arrests hit their lowest level since 1971; lower than when the state had half its current population.
Response times have ballooned: NYC response times to crimes-in-progress rose 22–46% across priority tiers between 2018 and 2023.
New Orleans' tripled, from 51 to 146 minutes.
Slower response times directly reduce the chance of solving crimes: a causal study of 300,000 incidents found a 10% increase in response time produces a 4.7-percentage-point drop in clearance rates (Vidal & Kirchmaier, 2018).
As crime analyst Jeff Asher has noted:
"Longer response times reduce the likelihood that an incident will be successfully reported to police, which in turn leads to crimes being undercounted."
Three distinct mechanisms suppress the statistics while leaving underlying criminal behavior untouched:
Legislative decriminalization and legalization: Statutes can redefine “crime” downward. Since 2000, at least 37 states have raised felony theft thresholds, meaning the same act can move felony → misdemeanor (or citation) purely by legislative relabeling. And legalization deletes entire arrest streams. In 2007 the FBI estimated ~1.8M drug-abuse-violation arrests; 42.1% were marijuana possession and 5.3% marijuana sale/manufacturing; meaning roughly ~850k+ marijuana arrests disappear from “crime” metrics as law changes. When the legal definition of “crime” shrinks, measured crime mechanically falls even if underlying behavior doesn’t.
Enforcement withdrawal: Fewer encounters, fewer arrests, fewer reports — and fewer reports mean fewer “crimes known to police.” The causal chain is mechanical.
Prosecutorial declination: When victims see cases dismissed: (1) Philadelphia’s DA cut total prosecuted criminal matters by ~50%; (2) Chicago’s Foxx raised felony dismissal rates to 29.9% — reporting likely drops because expected return on reporting (ROR) drops. Police effort declines for the same reason. The downstream effect on recorded crime is indirect but real.
Crime migrated online, and the toll is invisible

The FBI’s index crime categories were designed in 1929: burglary, larceny, auto theft, robbery, assault, murder, rape, arson. The criminal economy has moved on.
What follows is a partial inventory of victimization that does not appear in “crime is at historic lows” headlines.
1. Digital and cyber-enabled crime
The fastest-growing category, now larger than all traditional property crime combined.
Total IC3-reported losses: $16.6 billion in 2024, up 33% from 2023 and +1,400% since 2015. Cyber-enabled fraud alone — 334K complaints — accounted for $13.7B, or 83% of all reported losses.4
Investment fraud (predominantly cryptocurrency “pig butchering” schemes): $6.57B in losses, the single largest category. Crypto-related complaints totaled 150K with $9.3B in losses — up 66% YoY.
Business email compromise (BEC): $2.77B in losses ($8.5B over the last three years). Companies wiring funds to spoofed vendor accounts — essentially digital robbery at scale.
Tech support / customer support scams: $1.46B, overwhelmingly targeting the elderly.
Elder fraud (all categories): $4.9B in reported losses, up 43% YoY. Over 7,500 victims aged 60+ lost more than $100K each.
Identity theft: 490K → 1.135M FTC reports. Personal data breach complaints: 64,882 to IC3 alone, with $1.5B in losses.
Ransomware: Complaints up 9%, with 67 new variants detected in 2024. The reported $12M in losses is a fiction — it excludes lost business, downtime, and the majority of quietly paid ransoms. Actual ransomware costs likely exceed $1B annually.
Sextortion: 54,936 complaints, up 59% YoY — increasingly AI-generated, increasingly targeting minors. The FBI referred 42 victims to suicide intervention specialists.
These figures are themselves massive undercounts. IC3 acknowledges its numbers reflect only what victims choose to report. Corporate cyber theft, IP theft, and ransomware payments companies quietly absorb push the true scale likely past $50–100B annually.
2. Physical crime that moved off the books
Retail shrinkage: NRF's own National Retail Security Survey puts shrink at $112.1B and reports that internal + external theft account for ~65% of shrink — the majority. Retailers report closing locations, cutting hours, and altering product selection as a direct response to retail crime: 7,300+ store closures in 2024 (up 58% YoY), entire neighborhoods losing pharmacy and grocery access. And because shrink is a loss accounting measure, it captures theft that never becomes a police report.
Auto theft / insurance fraud: Auto insurance premiums up ~51% since 2019. Catalytic converter theft, VIN cloning, and title washing are rampant but poorly captured in index crime statistics. The NICB reported 850,708 vehicles stolen in 2024; direct, insured property crime at massive scale.
Insurance fraud (all categories): The Coalition Against Insurance Fraud estimates $308.6B/year in total insurance fraud costs, per NAIC — a figure that dwarfs all index property crime combined. The FBI estimates this costs the average family $400–700 annually in premium impact. None of it appears in “crime is down” statistics.
FTC consumer fraud: $12.5B in reported losses (2024), spanning romance scams, impersonation fraud, and fake investment platforms.
Mail theft–enabled check fraud: FBI and USPIS warn check fraud is surging, with suspicious activity reports (SARs) nearly doubling from 2021 to 2023. FinCEN’s BSA-based analysis (Feb–Aug 2023) flagged 15,417 related reports and >$688M in linked transactions, just from the slice that hits regulated reporting channels.
Cargo theft + supply-chain crime: CargoNet recorded 3,625 incidents in 2024, up 27% year over year; property crime increasingly shifting to logistics nodes rather than street confrontations. Traditional methods like trailer burglaries and full trailer theft remained prevalent.
Package theft / “porch piracy” (last-mile): USPS OIG estimates at least 58 million packages were stolen in 2024, with as much as $16 billion in reported losses. It also stresses there is no single authoritative source because reporting is fragmented and hard to verify; meaning this is almost certainly undercounted. Package theft can occur at multiple points in the shipping chain, but the OIG focuses on the unauthorized removal of packages from delivery locations (residences/businesses).
3. Government fraud
The largest category by dollar volume, and the most completely invisible to crime statistics:
Total federal fraud: The GAO estimated $233–521B annually in fraud across federal programs. Separately, the government documented $162B in improper payments in FY2024 alone ($2.8T cumulative since 2003) — improper payments are not all fraud, but they represent the exposure base from which fraud draws, and neither figure is an audited total. Both are estimates extrapolated from the fraction of transactions that get reviewed. Most federal programs lack the investigative capacity to detect sophisticated fraud at scale, so GAO’s figures represent a floor, not a ceiling.
Medicaid/Medicare fraud: Minnesota’s Medicaid scandal — $9B+ in suspected fraud across 14 programs in a single state, the scheme attracting “fraud tourists” from across the country — was only discovered because its sheer scale made it impossible to ignore. GAO estimates healthcare fraud nationally at $100B+, but that estimate is itself derived from limited audit samples.5 Every state runs the same programs with the same weak controls; Minnesota is not an outlier so much as the one that got caught.
Pandemic relief fraud: An estimated $100–200B in fraudulent PPP, EIDL, and unemployment claims. The SBA Inspector General identified $200B in potentially fraudulent EIDL loans alone. Programs were designed for speed over verification, and most fraud will never be recovered or even fully quantified.
Tax noncompliance: The IRS projects a $696B gross tax gap for Tax Year 2022, with $539B (77%) from underreporting on timely filed returns. Willful tax evasion (26 U.S.C. §7201) is a felony, but enforcement capacity has been gutted; the criminal component alone is enormous but nearly invisible to crime statistics.
The pattern across all three categories is the same:
Documented numbers represent the visible fraction of a problem whose true scale is structurally unknowable, because agencies responsible for disbursing funds lack the capacity (and often the political incentive) to measure how much is being stolen.
When DOGE or similar government oversight efforts periodically surface new fraud, the reaction is surprise, but the surprise itself is evidence that the baseline estimates were too low.
None of this stuff: the $16.6B in cyber losses, the $112B in shrinkage, the $233–521B in federal fraud — appears in the FBI statistics used to declare crime at “historic lows.”
The 1929 index measures muggings while the economy is being looted through fiber optic cables.
Has total criminal victimization actually declined?
You can’t collapse all ledgers into one neat “crime rate” because they’re measured in different units (incidents vs. dollars vs. administrative loss).
But you can compare orders of magnitude of harm, and the uncounted ledgers are now enormous.
The FBI reported $15.1 billion in property crime losses in 1995; roughly $31 billion in 2024 dollars.
In 2019 (the last year the FBI published this figure), the nominal total was $15.8 billion; essentially flat in real terms despite a 40% decline in reported property crime incidents.
Then add what the index excludes: $16.6B in IC3-reported cyber losses, $12.5B in FTC consumer fraud, $112B in retail shrinkage, $4.9B in elder fraud alone, and $233–521B in estimated federal program fraud.
Even conservatively, the total dollar volume of financial crime victimization in the United States has grown by an order of magnitude since the 1990s.
Anderson (2021) estimated the aggregate cost of crime at $4.71–5.76 trillion annually when including law enforcement, private deterrence, and intangible victim costs; roughly 20–25% of GDP.
And Anderson’s inputs predate the post-2020 explosion in cybercrime and government fraud so the estimate range may be lowballing.
The conventional crimes that generate “historic lows” headlines account for a small and shrinking share of total criminal harm; crime didn’t decline so much as migrate to channels the measurement system was never designed to see.
The immigration-sized hole
There are 14 million unauthorized immigrants (~4% of the population) concentrated in sanctuary jurisdictions with the most aggressive decriminalization and de-policing.6
These 14+ million people are structurally deterred from calling 911 when victimized: fear of deportation, language barriers, distrust of authorities. Domestic violence, sexual assault, and labor exploitation within these communities are notoriously undercounted.
The identity fraud dimension alone is enormous:
SSA’s Earnings Suspense File: Where W-2s with mismatched name/SSN combinations are held, has accumulated over $2.4 trillion in cumulative unmatched wages since 1937, with the file growing by tens of billions annually. Not all mismatches involve unauthorized work (employer errors and name changes contribute), but SSA explicitly acknowledges that invalid or stolen SSNs used by unauthorized workers are a major driver.
Employment-related identity fraud: GAO (2020) identified 1.3 million SSNs in a single year (2016) showing signs of fraudulent use for employment purposes.
Underground labor: A 2023 report estimates 1.1–2.1 million construction workers alone are misclassified or paid off-the-books (~10–19% of the workforce), shrinking tax compliance and placing worker injuries outside OSHA reporting.
Meanwhile, the FBI’s crime reporting system does not collect immigration or citizenship status of offenders or victims, the NCVS does not ask documentation status, and GAO (2024) confirmed there are no comprehensive citizenship data across state prisons and local jails.

The claim that “immigrants commit less crime” may be directionally correct for first-generation legal immigrants, but it is overconfident relative to what the main national data systems can actually observe for the unauthorized population specifically.
And as the National Academies has documented, crime rates among second- and third-generation immigrants converge toward native-born levels; so first-generation snapshots cannot settle multi-generational policy questions when the “immigrant” category disappears into “native-born” in most statistics after one generation.
The fog is structural, and it biases the data downward.
Behavioral avoidance and deterrence
Much of the measured decline reflects behavioral avoidance, not the elimination of danger.
Gallup found 40% of Americans afraid to walk alone at night in 2023; a three-decade high, though declining to 31% by late 2025.
Millions of people live in walled or gated communities.
Remote work eliminated commuting exposure for millions.
A low crime rate can reflect a safer environment and/or a population that has learned to avoid exposure — and the “official crime statistics” don’t distinguish between them.
Deterrence spending tells the same story from the other side: the private security industry alone is worth roughly $180 billion and private security guards now outnumber public police by roughly 2-to-1 (≈1.2M guards vs. <700k officers).
A society that has “solved crime” doesn’t need a parallel private-policing workforce.
Both avoidance and deterrence work (they push the rate down), but they represent a society buying down its crime rate through enormous private expenditure and behavioral constraint, not one that has eliminated the underlying threat.
Policy failure: repeat violent offenders
A society with every favorable condition imaginable: aging population, mass incarceration infrastructure, ubiquitous surveillance, record screen absorption — that still produces the following has a specific, identifiable problem:
Memphis: 7× the national violent crime rate
Detroit: 5.3× the national rate
Baltimore: 4.3× the national rate
Oakland: 0.1% of the population committed the majority of homicides
A major problem is the woke impulse to refuse incapacitating the ~5% of offenders who commit ~50% of violent crime; this would push violent crime down far more.
BJS data is a big problem. 70% of released prisoners are rearrested within 5 years.
When the NYPD shifted to precision gang takedowns, shootings fell by a third.
The 2025 precision zones produced a 40% decline in shootings.
Criminologist Thomas Hogan estimated ~75 additional homicides per year under Philadelphia’s Krasner; the cost of not incapacitating the power criminals.

The takeaway: “crime is down” needs nuance
America is less violent than the 1990s. The homicide decline is noteworthy — roughly halved from peak — driven by identifiable forces: the end of crack, incarceration, a massive time-use shift that keeps potential offenders indoors, demographic aging, policing innovation, and plausibly abortion legalization. Today’s murder rate may well be the lowest in modern American history, and possibly longer.
But “historic lows across the board” is where the narrative breaks down; we shouldn’t fully extrapolate the homicide story to all crime.
For nonfatal violence, the government’s own survey contradicts the claim.
For property crime, the measurement systems contradict each other, enforcement has collapsed, and the fastest-growing categories of financial victimization aren’t counted at all.
These are different kinds of evidence: incident rates and dollar losses are not directly commensurable, but they converge on the same conclusion: the index crimes that generate “historic lows” headlines now represent a small and shrinking share of total criminal harm.
In dollar terms, crime has not declined at all; it has grown by an order of magnitude.
FBI property crime losses were $15.1B in 1995 (~$31B inflation-adjusted); today’s total financial crime victimization: cyber, fraud, shrinkage, insurance fraud, government program losses — likely exceeds $400 billion annually, and Anderson (2021) puts the full aggregate cost at $4.7–5.8 trillion including enforcement and intangible costs.
The measurement distortions concentrate precisely where crime is highest: in the urban neighborhoods where police pulled back most aggressively, where reporting rates are lowest, where residents have the least capacity for private security or relocation.
The national average can decline to “record lows” while per-exposure risk in the worst areas stays flat or worsens, because the already-safe suburban majority drives the average down while victimization among the worst-off is systematically undercounted.
The thermometer is real. It is also broken in ways that systematically read low, it disproportionately measures the temperature in air-conditioned rooms, and the patient has learned to put ice on it before anyone takes a reading.

The medical-care hypothesis; Harris et al. (2002) estimating murder would be 3–5× higher without advances, has been substantially undermined. Eckberg (2015) showed the assault/murder divergence was driven by improved assault reporting, not medical saves. Sakran et al. (2018) found pre-hospital gunshot mortality went up 4× from 2007–2014 while in-hospital survival improved, roughly canceling. Cook et al. (2017) found case fatality constant from 2003–2012. A 2024 LA study found case fatality increasing 1.3%/year (Brantingham et al., 2024). Both homicide and aggravated assault are declining together from 2019 — which undercuts the theory that medical improvements are artificially suppressing murder counts.
The Donohue-Levitt hypothesis is that legalized abortion reduced crime by preventing unwanted births among populations at highest risk for criminal behavior — younger, poorer, less stable households. Their 2020 replication with 17 additional years of data found the effect strengthened, estimating abortion accounted for ~45% of the 1991–2014 crime decline. The demographics of abortion usage align with the demographics of criminal offending, making the selection mechanism plausible. Critics (Joyce 2006, 2009; Foote & Goetz 2008) argue the identification strategy is fragile and confounded by the crack epidemic's timing. The post-Dobbs environment (2022–) may eventually provide a natural experiment testing the hypothesis in reverse.
What aging cannot explain: rapid short-run swings like the 2023–2025 drops (age composition changes too slowly) and the international crime drop across countries with very different demographic profiles. The PPIC found young adult (18–22) violent felony arrest rates in California dropped over 50% from 1994–2019, with post-1993 cohorts showing 20–25% lower offending even after controlling for age (Lofstrom & Raphael, 2022). This suggests generational decline beyond demographics; but California's property crime clearance rate also fell from 11% to 7% post-pandemic, so declining arrest rates may partly reflect declining enforcement.
The IC3’s $16.6B is a massive undercount. Corporate cyber theft, IP theft, and ransomware payments companies quietly make push the actual scale likely past $50–100B annually. None appears in FBI index crime statistics.
Minnesota's Medicaid fraud is instructive as a case study of scale. Fourteen high-risk programs billed $18B since 2018; prosecutors estimate half or more was fraudulent. A housing program projected at $2.6M annually ballooned to over $100M; a children's autism program grew from $3M to $400M. The scheme attracted "fraud tourists" from other states. Separately, the Feeding Our Future case involved $300M in pandemic nutrition fraud — the largest pandemic fraud case prosecuted, with 82 of 92 defendants from the Somali-American community per the US Attorney. These are the cases that were caught. GAO's $233–521B annual estimate for federal fraud losses suggests the documented scandals represent a fraction of total government fraud nationally, most of which is never investigated, let alone prosecuted or counted as "crime."
This analysis focuses on data distortion from a large unauthorized population’s interaction with crime measurement systems. A precision note: unlawful presence is generally a civil violation, not a criminal offense (CRS). But unauthorized entry (8 U.S.C. §1325), illegal reentry after removal (8 U.S.C. §1326), harboring (8 U.S.C. §1324), and working with fraudulently obtained SSNs (42 U.S.C. §408) are unambiguously criminal. These are not theoretical: the U.S. Sentencing Commission reports 17,336 immigration offense cases among 61,678 total federal cases in FY2024 — 28% of all federal cases sentenced and reported to the Commission (not all prosecutions, but the best proxy for scale). If immigration criminal violations were included in “crime” discussions, the picture would look radically different, but this piece focuses on the public safety question rather than legal status.