Trump Tariff Formula Analysis (2025): Elasticity & Pass-Through Rates Matter - But the Big Picture Stays the Same
Tariff formula defenders have called critics "pseudo-intellectuals" for failing to consider elasticity & pass-through rates.
Trump’s Liberation Day tariffs were unveiled April 2025… and reactions have been nothing short of polarizing.
Many smart people think the tariffs are a byproduct of generational-level retardation exhibited by the POTUS.
Others are relatively neutral or think the tariffs will be “some good with some bad” (i.e. a mixed bag)… not nearly as bad as critics claim, but perhaps less sanguine than the Pollyanna’s imagine.
And other cohorts are fully on board the Trump Train & MAGA Express, typically: (1) MAGA mind virus types that just wait for the *current-right-wing-thing* to load in their brains and support and/or (2) guys with insider trading information (re: implementation, timelines, etc.).
Whether you’re for or against the Trump tariffs is largely irrelevant to me… I care more about the logic behind your stance. At this moment, there’s no solid logical case to support the Trump tariffs because no coherent policy has been presented.
Is Trump “negotiating” mega deals? Is Trump trying to tank the market intentionally? Is Trump really trying to bring manufacturing back to the U.S.? Will Trump call off the tariffs tomorrow? Nobody knows. It’s a reality TV show.
Shh… it’s 7D chess (don’t tell anyone). Oh yeah. I thought we were at least up to 8D or 9D by now though.
The reality? The Trump admin falsely framed “Liberation Day” tariffs as being reciprocal tariff terms (i.e. mirroring precisely what other countries tariff the U.S.) — yet most with functional prefrontal cortexes quickly realized that the tariffs were (*checks notes*): not in fact reciprocal tariff terms.
Instead: Trump’s tariffs were based on “trade deficits” rather than “trade terms.”
Any country which has a trade deficit with the U.S. (i.e. sells more to the U.S. than it buys from the U.S.) is tariffed… and the size of these tariffs are determined by the magnitude of trade deficits (minimum 10% tariffs).
Why would Trump do this? Many aren’t sure. Some speculate that Trump may believe one or more of the following:
Trade deficit = America getting hustled out of $$$
Trade deficit = National debt (or a major cause of it)
Tariffs will bring back American jobs (manufacturing) & punish exploiters
Tariffs worked in the past — they’ll work now
Short-term pain guarantees long-term gain
His economic team (Bessent, Lutnick, Navarro) approved so it must be a “high IQ” genius plan
Anyways, many quickly analyzed the “reciprocal” tariff formula published by the Trump administration. (Reciprocal Tariff Calculations)
Critics compared 2024 “trade deficit” figures with formula outputs for various countries, confirming suspicions that the formula was engineered to target “trade deficits” rather than “reciprocal trade terms.”
Some critics alleged the formula was likely created by ChatGPT and that staff royally F’d up in formula and/or calculations. Is this true? Not really sure (it’s possible this is what the Trump admin actually wanted).
Defenders of the formula began calling critics “pseudo-intellectuals” for framing the formula as a “trade deficit” tariff formula — without contemplating technical elements like elasticity and pass-through rates.
From my perspective?
Critics were pointing out that the whole tariff framework is laser-focused on trade deficits. That’s not wrong.
Defenders of the tariff formula imply that critics don’t understand technical elements like elasticity and pass-through rates. This isn’t necessarily incorrect either. (But defenders fail to consider that many critics are aware of elasticity & pass-through rates but don’t feel the need to mention them for various reasons.)
Let’s break this down objectively: What’s actually in the formula, what the critics are really saying, what defenders are arguing, and whether those extra details even matter in the real world. Spoiler: Probably not.
Related: King Trump & the MAGA Mind Virus: Trade Deficit Tariffs & Delusions of Economic Grandeur
I.) Trump Admin Rolls out Tariffs (April 2025)
In April 2025, President Donald Trump’s administration introduced a series of Liberation Day tariffs.
A 10% universal tariff on all imports
Additional “reciprocal” tariffs on countries with significant bilateral deficits
The stated objective is to reduce persistent U.S. trade deficits and protect domestic industries.
However, the formula used by the USTR (United States Trade Representative) for these reciprocal tariffs has provoked an intense debate.
Critics say the formula is merely a “trade deficit calculator” ignoring broader economic realities.
Supporters call these critics “pseudo‐intellectuals,” claiming they overlook the formula’s behavioral assumptions about how tariffs affect import demand and consumer prices.
Related: Trump Tariffs vs. ASAP Protocol to Fix U.S. Debt & Grow the Economy
II.) Trump’s Trade Deficit Tariff Formula & Criticism
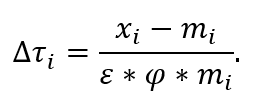
Δτᵢ = (xᵢ – mᵢ) / (ε × ϕ × mᵢ)
Where:
xᵢ = U.S. exports to country i
mᵢ = U.S. imports from country i
ε = elasticity of import demand
ϕ = pass-through rate of tariffs to consumer prices
Δτᵢ = the calculated tariff rate needed to “balance” trade
Result: The bigger the deficit (i.e. the more mᵢ exceeds xᵢ), the larger the numerator (xᵢ – mᵢ) becomes in magnitude, which drives the tariff Δτᵢ higher. This leads critics to conclude:
The administration is simply punishing large trade-deficit countries with a big new levy.
Quick Example
Imagine the U.S. imposes a 10% tariff (a tax on imports) on imported washing machines.
Pass-through refers to how much of the tariff cost is passed onto consumers through higher prices.
The administration claims a 25% pass-through, meaning consumers would see prices rise by only 2.5% (10% tariff × 25% pass-through).
Real-world studies typically show pass-through around 50%, meaning the actual price increase for consumers would likely be closer to 5% (10% tariff × 50% pass-through).
Elasticity of import demand measures how sensitive import volumes are to price changes. An elasticity of 4 means that for every 1% price increase, imports fall by about 4%.
Using the administration’s optimistic elasticity (4), a 2.5% price increase would cut imports by 10% (2.5% × 4).
But real-world elasticity is usually around 1 to 2, meaning a 5% price increase realistically only cuts imports by 5–10% at most.
In reality, tariff-driven price increases for consumers are higher—and the resulting drop in imports smaller—than what the administration predicts.
Criticism
Bilateral deficits not always “unfair”: A deficit with Country A may be offset by a surplus with Country B. Economists generally see aggregate (not bilateral) deficits as more relevant, driven by macro factors (e.g., savings/investment imbalances).
2018–2020 tariffs: Critics point to earlier Trump tariffs against China and other nations, which aimed to reduce deficits but did not produce the expected gains. Instead, they contributed to consumer price hikes and complex retaliation cycles, with limited net improvement in the trade balance.
Consumer impact: Many critics highlight that low‐income households spend a large share of their budget on import‐heavy goods. Past data show these groups bear a disproportionate burden when tariffs push up prices.
Critics argue: “At its core, this formula—and policy—prioritizes bilateral deficit reduction above all else, ignoring standard trade theory and real supply chain constraints. Whether or not it includes additional terms, it’s still functionally the same approach.”
III.) Defenders: “Critics Are Missing Key Variables”
A.) Elasticity (ε): High Responsiveness
The original USTR formula includes:
Δτᵢ = (xᵢ – mᵢ) / (ε × ϕ × mᵢ)
In the official announcements, the USTR assumes ε ≈ 4, meaning they claim that for every 1% increase in import prices, import demand will fall by 4%. However, empirical studies typically show elasticity values between 1–2 for most manufactured goods, suggesting this assumption is highly optimistic.
Defenders argue:
This is not just a deficit ratio: if imports are extremely price‐sensitive, even a modest tariff can drastically shrink imports, thereby legitimately balancing trade flows.
B.) Pass‐Through (φ): Who bears the cost?
The formula also includes ϕ ≈ 0.25. The administration cites experiences with prior China tariffs, claiming:
The administration claims that “only 25% of tariff costs are passed on to U.S. consumers, with foreign exporters bearing the rest.” However, extensive empirical research (Amiti et al., 2019; Cavallo et al., 2021) finds actual tariff pass-through rates are typically higher — between 30–50% for consumer goods and up to 80% or more in industries with fewer substitutes (e.g., steel, aluminum, automobiles).
Hence, defenders argue:
Minimized Consumer Pain: If ϕ is truly low, that counters the critics’ fear that “tariffs = higher consumer prices.”
Deficit Focus Is Not the Only Goal: The high elasticity ensures real behavioral change (import substitution), while low pass‐through protects consumers.
Why defenders call critics “pseudo-intellectuals”…
From the defenders’ viewpoint, anyone who dismisses the formula as a mere “deficit function” fails to engage with these deeper theoretical variables.
They consider it a sign of “intellectual laziness” or ignoring the economic modeling at the policy’s heart.
Big Picture: Trump Tariff Formula (2025) — Critics Remain Directionally Accurate
Theory vs. Practice
The Trump administration’s tariff formula explicitly incorporates two crucial economic variables intended to differentiate it from mere deficit targeting.
Elasticity of Import Demand (ε ≈ 4): The administration assumes a high elasticity of approximately 4, suggesting a significant reduction in imports (4%) for every 1% increase in prices due to tariffs.
Tariff Pass-through (ϕ ≈ 0.25): The administration argues only 25% of tariff costs ultimately pass through to U.S. consumers, implying that foreign exporters absorb most of the cost.
In theory, these assumptions mean the administration expects moderate tariffs to sharply reduce import volumes and correct trade imbalances without causing significant consumer pain.
However, real-world evidence largely contradicts these optimistic assumptions.
Real-world elasticities consistently measure lower, around 1–2, especially in manufacturing-heavy sectors (automobiles, electronics, machinery). This substantially diminishes the predicted reduction in imports.
Pass-through rates, as measured by detailed empirical analyses (e.g., Cavallo et al., 2021; Amiti et al., 2019), are commonly 0.3–0.5 for consumer goods, and often even higher (up to 0.8) for sectors with fewer substitutes, like steel, aluminum, and automobiles.
Supply chain rigidity & limited substitution further constrain practical import reductions, as many sectors lack sufficient domestic or alternative foreign sources, particularly advanced manufacturing and technology industries.
Evidence from 2018–2020 Tariffs
The administration’s prior experience with similar tariff policies provides a critical reality check.
Import Volumes: The observed decline was notably smaller than the USTR's assumed elasticity would suggest, pointing toward elasticities closer to empirical measures of 1–2 rather than 4.
Consumer Prices: Tariffs led directly to higher consumer prices, with typical household costs rising between $1,400–$2,800 annually, indicating actual pass-through significantly above the administration’s theoretical 25% rate.
Trade Deficits: Tariffs reduced bilateral deficits with China modestly, but largely shifted trade patterns rather than resolving the overall imbalance. Deficits with other countries often increased, leaving the aggregate trade deficit largely unchanged.
Distributional Impacts: Low- and middle-income households disproportionately felt the tariff impact, given their higher spending shares on tariffed imported goods.
Probability & Confidence Assessment
Odds (20–30%): There's a modest chance that administration assumptions might hold true in select, highly competitive sectors (e.g., textiles or specific agricultural commodities) where price elasticity and pass-through conditions closely match theoretical expectations.
Odds (70–80%): The predominant outcome will closely resemble the past experiences from 2018–2020—moderate reductions in import volumes, notable price increases, limited net improvement in overall trade balances, and pronounced negative distributional impacts.
Confidence Level: High — that the critics’ projected scenario (consumer pain, limited import substitution, minimal trade improvement) will manifest broadly again, due to substantial empirical support and demonstrated past results under comparable policies.
Bottom Line:
While defenders are technically accurate that select critics may have oversimplified by focusing solely on deficit targeting, the inclusion of elasticity (ε) and pass-through (ϕ) variables in the formula does NOT meaningfully alter practical outcomes for most industries and goods.
Real-world evidence strongly indicates:
Elasticities are typically far lower than assumed by the administration.
Pass-through rates frequently exceed administration estimates, meaning higher consumer prices.
Supply-chain limitations sharply restrict effective import substitution.
Critics’ warnings — that this is primarily a deficit-targeting policy leading to predictable side effects (higher consumer costs, limited actual correction in overall deficits) — remain directionally accurate.
The Trump admin’s nuanced theoretical framework, while potentially defensible, fails to translate effectively into differentiated real-world outcomes.


