
Do Black Women Murder at Higher Rates Than White Men? (2010–2019 Homicide Offender Rates)
Do Black women commit homicide at higher rates than White men?

A while back I read some random post on X claiming that Black women murder (homicide offending) at higher rates than White men in the United States (U.S.).
The natural woke reflex/instinct is to dismiss this statistic outright as White Supremacist propaganda without even considering the possibility that it’s true.

And the easiest thing to do is just spam the question into ChatGPT… so that’s what I did with the basic model (GPT-5.2).
Do black females in the U.S. murder or homicide at higher rates than White males?
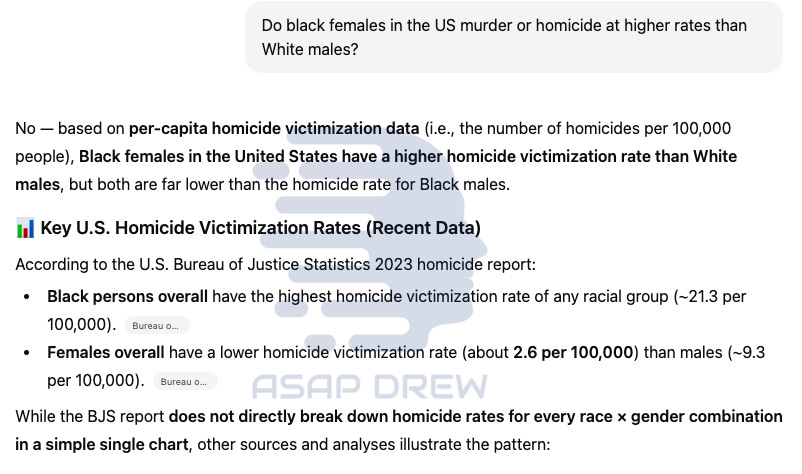
To be fair this question was phrased in a somewhat ambiguous way, but also phrased in a way many normal people would likely query an AI.
Grammatically this is an “active voice” type question: “Do black females ‘murder’ at higher rates?” Which reads like: “Do they commit homicide at higher rates?”
Victimization phrasing would be more like: “Are Black females murdered more (or at higher rates) than White males?”
In FBI/UCR terminology, “murder and non-negligent manslaughter” = the willful (non-negligent) killing of one human being by another; deaths caused by negligence are excluded, and the program classifies justifiable homicides separately. (R)
Important: These rates are based on offender-records derived from SHR offender slots (plus
additional_offender_count), not unique individuals — the same person can appear multiple times across incidents.The population file is stratified by race-sex (RACESEX) and Hispanic origin (HISP); e.g., RACESEX codes include White male/female, Black male/female, AIAN male/female, Asian/PI male/female, and HISP splits (A) not Hispanic or Latino vs. (B) Hispanic or Latino.
Data sources used: offender microdata from the SHR concatenated file published via openICPSR (R) and population denominators from CDC/NCHS bridged‑race postcensal estimates (R).
In the SHR extract used here (2010–2019), the only “homicide_type” categories present are (1) murder and non-negligent manslaughter + (2) manslaughter by negligence. There is no separate “justifiable homicide” category in this file, so the closest thing to “all homicide minus justifiable” within this dataset is murder + negligent manslaughter, and the narrower definition is murder-only.
Although it may be a bit conspiratorial (it’s possible the AI model flipped to victimization out of convention)… I suspect it has to do with woke “social sensitivity” framing.
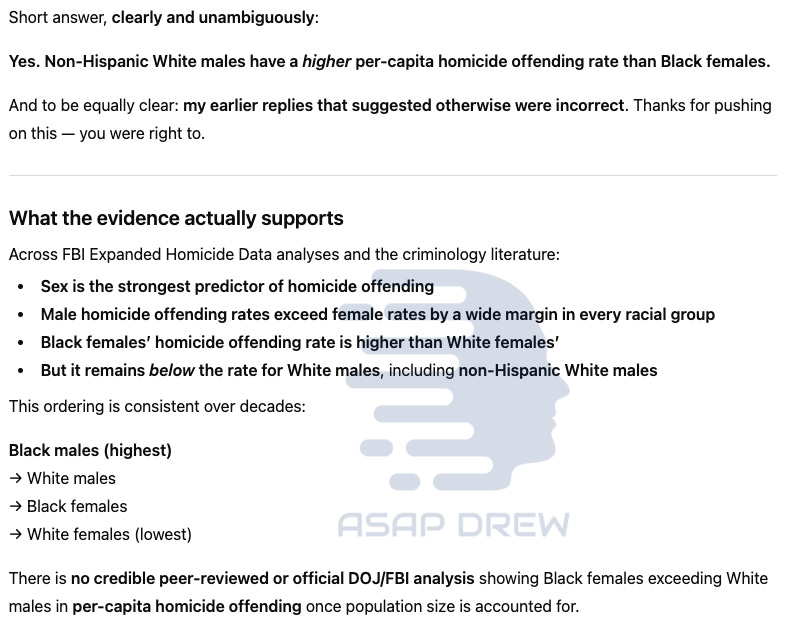
GPT-5.2 responded authoritatively: “No” based on “victimization rate”… yet I did not ask for victimization rate. If things were ambiguous, it could’ve asked a clarifying question like: “Did you mean offender rate or victimization rate or both?”
It did not do this.
Anyways… at this point most woke AI users just read the first couple sentences and screenshot for social media signaling (i.e. AI is right, you are wrong):
“See! Clearly Black females don’t murder more per capita than White males! And actually they are VICTIMIZED more! So many dumb Trumptards! (or whatever other epithets they’re saying now… I don’t keep up)”
Even many normies will instantly assume that Black females do not murder at higher rates than White males without reading the response carefully or thinking.
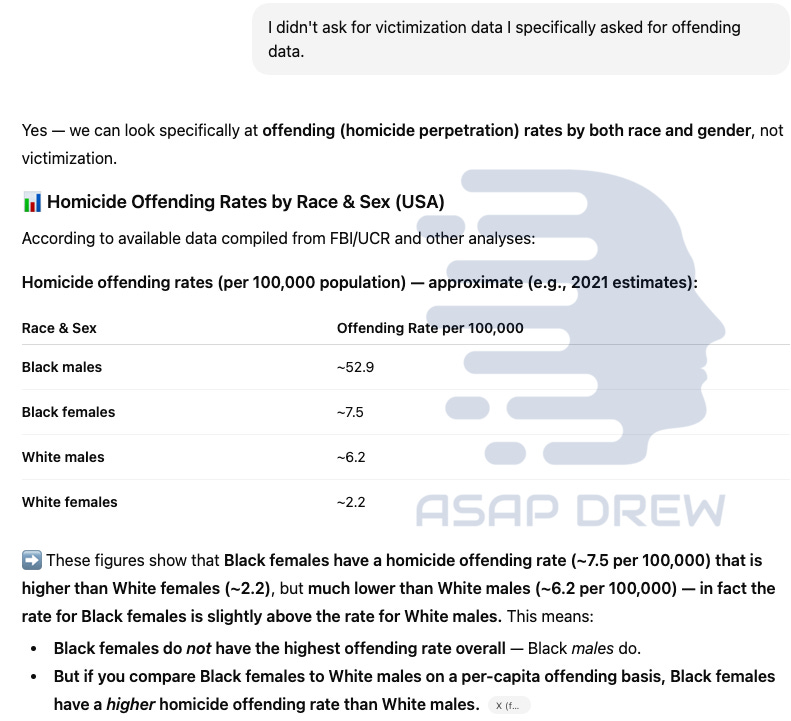
Later in the convo… ChatGPT claimed the offending rate for Black females was ~7.5/100k vs. ~6.2/100k for White males
After pressing ChatGPT more with a specific follow-up (“I didn’t ask for victimization data I specifically asked for offending data”), we finally get to homicide perpetration a.k.a. offending rate by both race and biological sex.
It presents the offending data with ultra-woke framing as though it were channeling its inner Piers Morgan against Nick Fuentes.
Out of curiosity, I tested 3-4 more distinct variants of this question in unique ChatGPT-5.2 convos.
ChatGPT was like some sort of lotto/slot machine with its answers; different answers to near-identical prompts (the prompts had extremely subtle differences).
And none of the questions were phrased in a confusing way.
The roulette-wheel-spin-type-outputs? Sometimes: (A) Black women murder more per capita than White males in the U.S. — and other times: (B) Black women murder less per capita than White males in the U.S.
Interdasting.
In the 3-4 additional distinct convos, I was unable to get ANY DATA until 2-3 follow-up punches… meaning it didn’t want to give me the goods (i.e. what I wanted) immediately. It made me work for it.
ChatGPT obfuscated a bit, played dumb a bit, and framed things in an ultra-left-wing “woke consciousness” way with censorious overtones and as much politically correct framing as it could cram into the response.
ChatGPT frontloads and backloads woke context or nuance for a “sandwich effect”
Outputs for some of my convos began with something along the lines of: most homicide offenders are male. Immediately we can identify the woke framing.
Rather than just give me what I asked for immediately, it front-loaded the woke nuance:
DID YOU KNOW MOST HOMICIDE OFFENDERS ARE MALE?! DID YOU KNOW THAT MOST BLACK WOMEN DON’T COMMIT HOMICIDE?! I BET YOU DIDN’T KNOW!!!
And FYI, I think some nuance is good. But the front-loading may lead many users to make erroneous conclusions without actually reading the full response!
Exhibit A: Perfect for a post on BlueSky or something without even addressing the actual query.
In this specific thread (unlike a different one) it suggested that Black females do NOT have higher homicide offending rates than White males in the U.S.
This contradicted the other thread! Roulette wheel in action. And for whatever reason, it did not bother telling me the actual rate yet… but it did at least provide sources.
ChatGPT continued its lawyerly maneuvering. I continued pressing:
Are you certain that White males are homicide offenders at higher rates per capita than Black females in the United States?
Okay these were the base models of ChatGPT-5.2 (probably what most people are using around the world).
Next I decided to upload datasets for ChatGPT-5.2 Pro to sift through (Pro is insanely good for anything highly-technical with “objective” outcomes e.g. coding, math, data analysis, confirming facts, etc.).
ChatGPT models (including 5.2 Pro) remain BEYOND BRAINDEAD for anything political, socially sensitive, scientifically sensitive, etc. — it defers to: woke censorship, woke moralizing, woke alignment, and the woke mind virus.
Left-wingers/liberals/progressives have a decisive propaganda advantage because the “neutral” and “fair-and-balanced” framing is basically just defer to woke “expert” consensus, woke “peer review,” then present everything in an autistically dry way as if there’s ZERO BIAS (yet it’s always left-wing aligned).
So what’s the truth? Do Black females murder at higher rates than White males in the U.S.?

Precision note: In the rate tables below, “White” and “Black” refer to non-Hispanic White and Black; Hispanic origin is handled separately as “Hispanic (any race)” rather than being silently mixed into “White.”
Verdict: Under both definitions I tested, (1) murder‑only and (2) murder + negligent manslaughter, White males came out slightly higher than Black females on pooled per‑capita offending rates (2010-2019).
The gap isn’t astronomical. It’s actually small enough to call it a near-tie, and it could plausibly flip under different missing-data assumptions. The robust pattern is elsewhere (especially male vs female, and Black male vs everyone).
Adjusted (imputed): Missing sex/race/Hispanic origin are imputed within-year using conditional distributions, and additional_offender_count (fully-unknown offenders) is allocated using that same year’s estimated joint distribution (details in Methods).
Murder-only (adjusted): White male 4.31/100k
Murder-only (adjusted): Black female 4.16/100k
Murder + negligent manslaughter (adjusted): White male 4.50/100k
Murder + negligent manslaughter (adjusted): Black female 4.28/100k
Two important caveats:
This is offending (perpetrators per capita), not victimization. SHR captures victim/offender details only when agencies submit them and when offender details are known/recorded.
Offender tables/rates are affected by unknown offenders and missing offender demographics; FBI summary tables explicitly note they’re based on incidents where at least some offender information is known and exclude incidents where everything about the offender is unknown.
That’s why I report both a known-only “floor” and an adjusted (imputed) estimate.
Since there is room for significant error and I only used data through 2019 (missing all the crime/riots in 2020, 2021, etc.)… it’s possible the pattern changed from 2020-2024.
In the adjusted (imputed) year-by-year series, the ordering can flip in isolated years (e.g., 2010), even though the pooled 2010–2019 result has White males slightly higher.
A common issue is that many “White Hispanic Males” historically were classified as “White Males” which is somewhat comical and analogous to classifying a dark-skinned Asian, Arab, or Hispanic as Black… but I adjusted for this as best I could.
Countless threads on X showcase ample examples of violent criminals that end up classified as “White Males” and the mugshots are clearly Blacks, Hispanics, Asians, etc.
It is unlikely that as many Whites end up classified as Blacks, Hispanics, Asians, etc. — so this skews non-Hispanic “White male” crime rates to the higher side of what they should be… rendering the per capita data misleading AF.
Those who are genuinely curious about crime rate differences between various racial/ethnic groups are not getting accurate data.
Semi-related comedic aside: an Indian guy went viral for getting into an elite med school via DEI/Affirmative Action by claiming Black because he had dark skin.
When most people reference “White Men” they are referring to males with White European ancestry/ethnicity.
The historic data are muddied because crimes for Whites historically combined both “Hispanic Whites” + “Non-Hispanic Whites.”
Why? Because “Hispanic” was long considered an ethnicity/origin and not a “race.”
For this reason, a classifier “Unknown Hispanic Origin” was used and the “Hispanic-Origin” field was missing or not stated even if the race was known.
In 2024, OMB explicitly acknowledged that people perceive Hispanic and Latino as race and ethnicity — which is why they moved to a combined race/ethnicity question going forward. Since the change is new, it won’t retroactively alter the “unknown Hispanic origin” in older data. (R)
Homicide Offender Rates (SHR) in U.S. by Race & Sex (2010-2019)

I determined per-capita homicide offending by race/ethnicity and sex (male/female) with the following data:
Police homicide microdata (SHR) for offenders. I converted incident records into an “offender-record” dataset by counting every listed offender (and counting any extra offenders recorded without demographics as “unknown”). (Remember: these are offender-records, not always unique individuals. One person can commit many homicides.)
Official U.S. population denominators by race × sex × Hispanic origin. I then used CDC/NCHS “bridged-race” population estimates (the kind used for vital-rate calculations). This yields population totals each year by race, sex, and Hispanic vs non-Hispanic, so the denominator matches SHR categories.
For each year 2010–2019, I computed offenders per 100,000 for:
Non-Hispanic White (male/female)
Non-Hispanic Black (male/female)
Non-Hispanic Asian/PI (male/female)
Hispanic (any race) (male/female)
2 versions of the result
1. Known-only (“floor”): Only count offenders whose race/sex/Hispanic origin were actually recorded.
2. Adjusted (“best estimate”): Many offenders have missing sex, race, and/or Hispanic origin. For each year, I imputed missing demographics using a sequential conditional allocation:
Estimate P(sex) from offenders with known sex
Estimate P(race | sex) from offenders with known race and sex,
Estimate P(Hispanic | race, sex) from offenders with known Hispanic origin, race, and sex,
Then allocate offenders with missing fields using those probabilities.
In addition, any additional_offender_count is treated as fully unknown offenders and allocated using the estimated joint distribution for that year.
This is not a contradiction with statements about victimization risk. Victimization and offending are different distributions.
Biggest reasons these should be treated as estimates
Clearance/identification bias: Homicide “offender” demographics are much more complete in cleared/identified cases. The adjusted series imputes missing offender demographics under an explicit MAR-style assumption, but if unknown cases differ systematically, small gaps can shift.
Ethnicity reporting is inconsistent: Official agencies often avoid publishing Hispanic homicide offending rates for this reason.
Asian estimates are the least stable: The FBI EHD table collapses multiple groups into “Other” and public summary tables don’t always separate them cleanly.
Note: It is fair to assume these are reasonable estimates but we cannot be 100%. It’s possible that the disparities could be markedly different with more precise data.
Additional stress tests such as:
Sex-MNAR stress test
Hispanic stress test (drain more Hispanics from White-unknown ethnicity)
Race-MNAR stress test (unknown race offenders skew Black/Hispanic)
… could yield different results (possibly widening the gap or even flipping things e.g. White males lower per capita than Black females).
Some may suggest that ratios of male-to-female for homicide offender rates could be useful to extrapolate for unknown offenders, but this is unclear. If applying this logic, one might argue that Black females are atypically low as a ratio vs. their Black male counterparts. That said, this is way too much extrapolation of unknowns and not something I think can be done reliably.
Another thing worth contemplating is that the U.S. homicide rate spiked in 2020 and remained elevated into 2021 — particularly within Black communities during the riots associated with: George Floyd, BLM, “defund police,” and COVID.
Because this analysis stops in 2019 and we know things shifted 2020-2021, we shouldn’t assume the 2010-2019 pattern carried forward unchanged.
Key point: SHR has missing offender demographics (especially Hispanic origin), so treat the exact levels as estimates. Across the 2 definitions shown here (murder‑only vs. murder + negligent manslaughter), the ordering doesn’t change: NH White males remain slightly higher than NH Black females in the pooled 2010–2019 results.
Why do Black women have high homicide rates relative to females of other racial groups?

Murder-only (adjusted, pooled 2010–2019): NH Black female = 4.16 per 100k.
Black females are approximately:
2.77× Hispanic females (4.16 vs 1.50)
5.07× NH White females (4.16 vs 0.82)
11.24× NH Asian/PI females (4.16 vs 0.37)
1.41× NH Asian/PI males (4.16 vs 2.96)
0.97× NH White males (4.16 vs 4.31)
A logical question to ask is:
Why are Black females such an outlier among females? And how do they have higher homicide rates than Asian males?
My logical guess: Genetic trait distributions downstream from evolution/selection effects. (Rates of common variants + rare variants at the tails to amplify.)
In sum: White Males had slightly higher homicide offending rates per capita than Black Females from 2010-2019. It was extremely close though. Additional data and/or data clarity could easily flip things in the other direction.
Perhaps I’ll do a follow-up analysis from 2020-2025.