
Bitcoin as a Global Liquidity Barometer in 2026: The Correlation Is Real, But the Lag Shifts
The Lyn Alden thesis still holds up. What four years of G4 broad money data say about where BTC goes next.

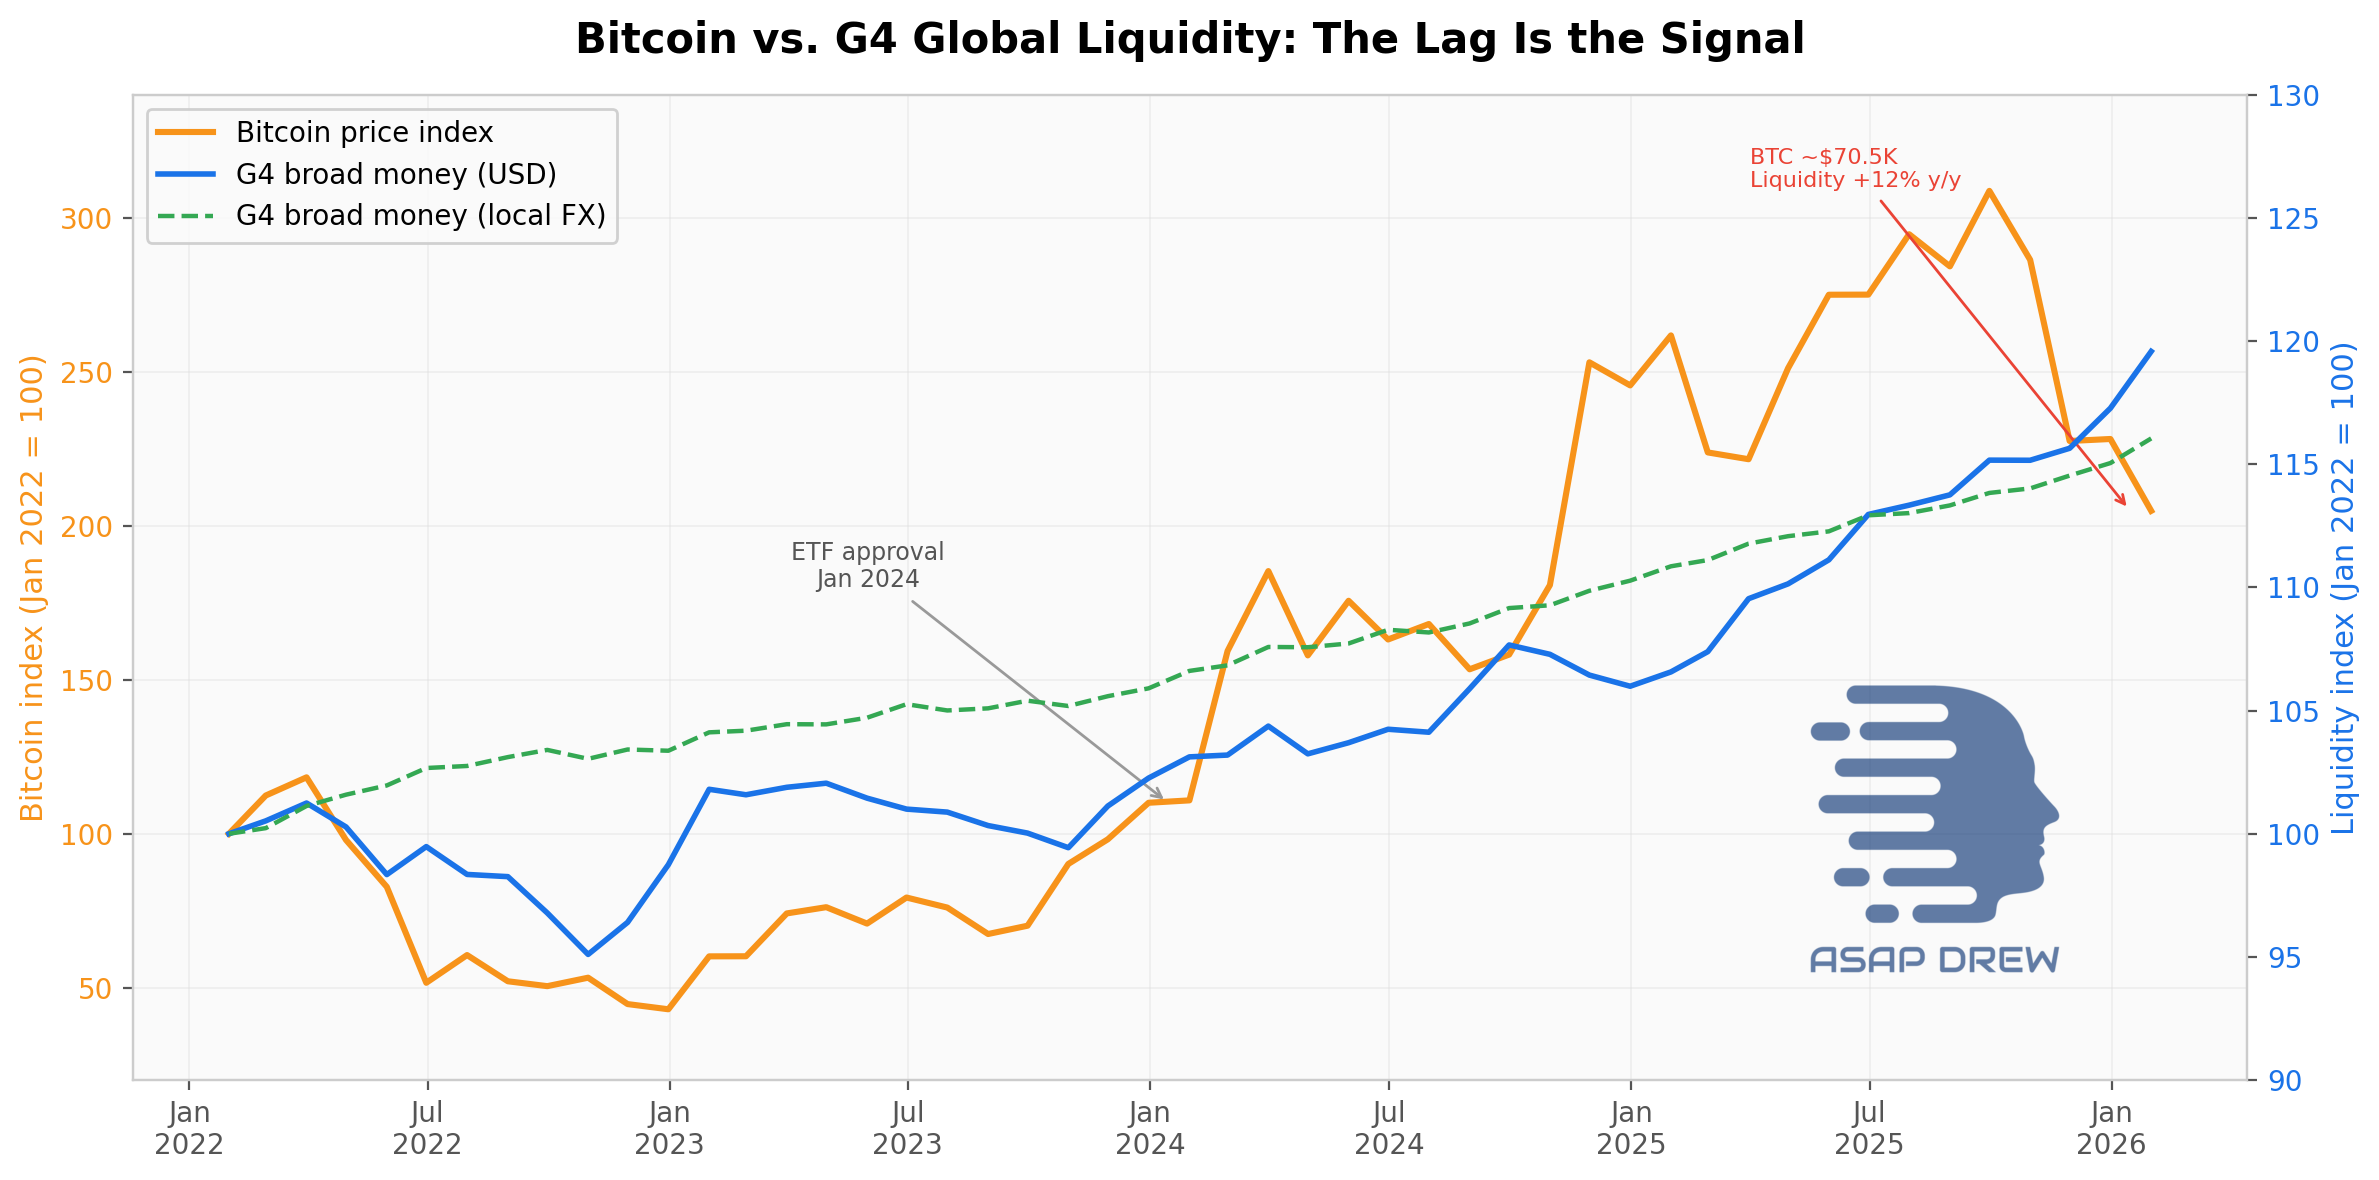
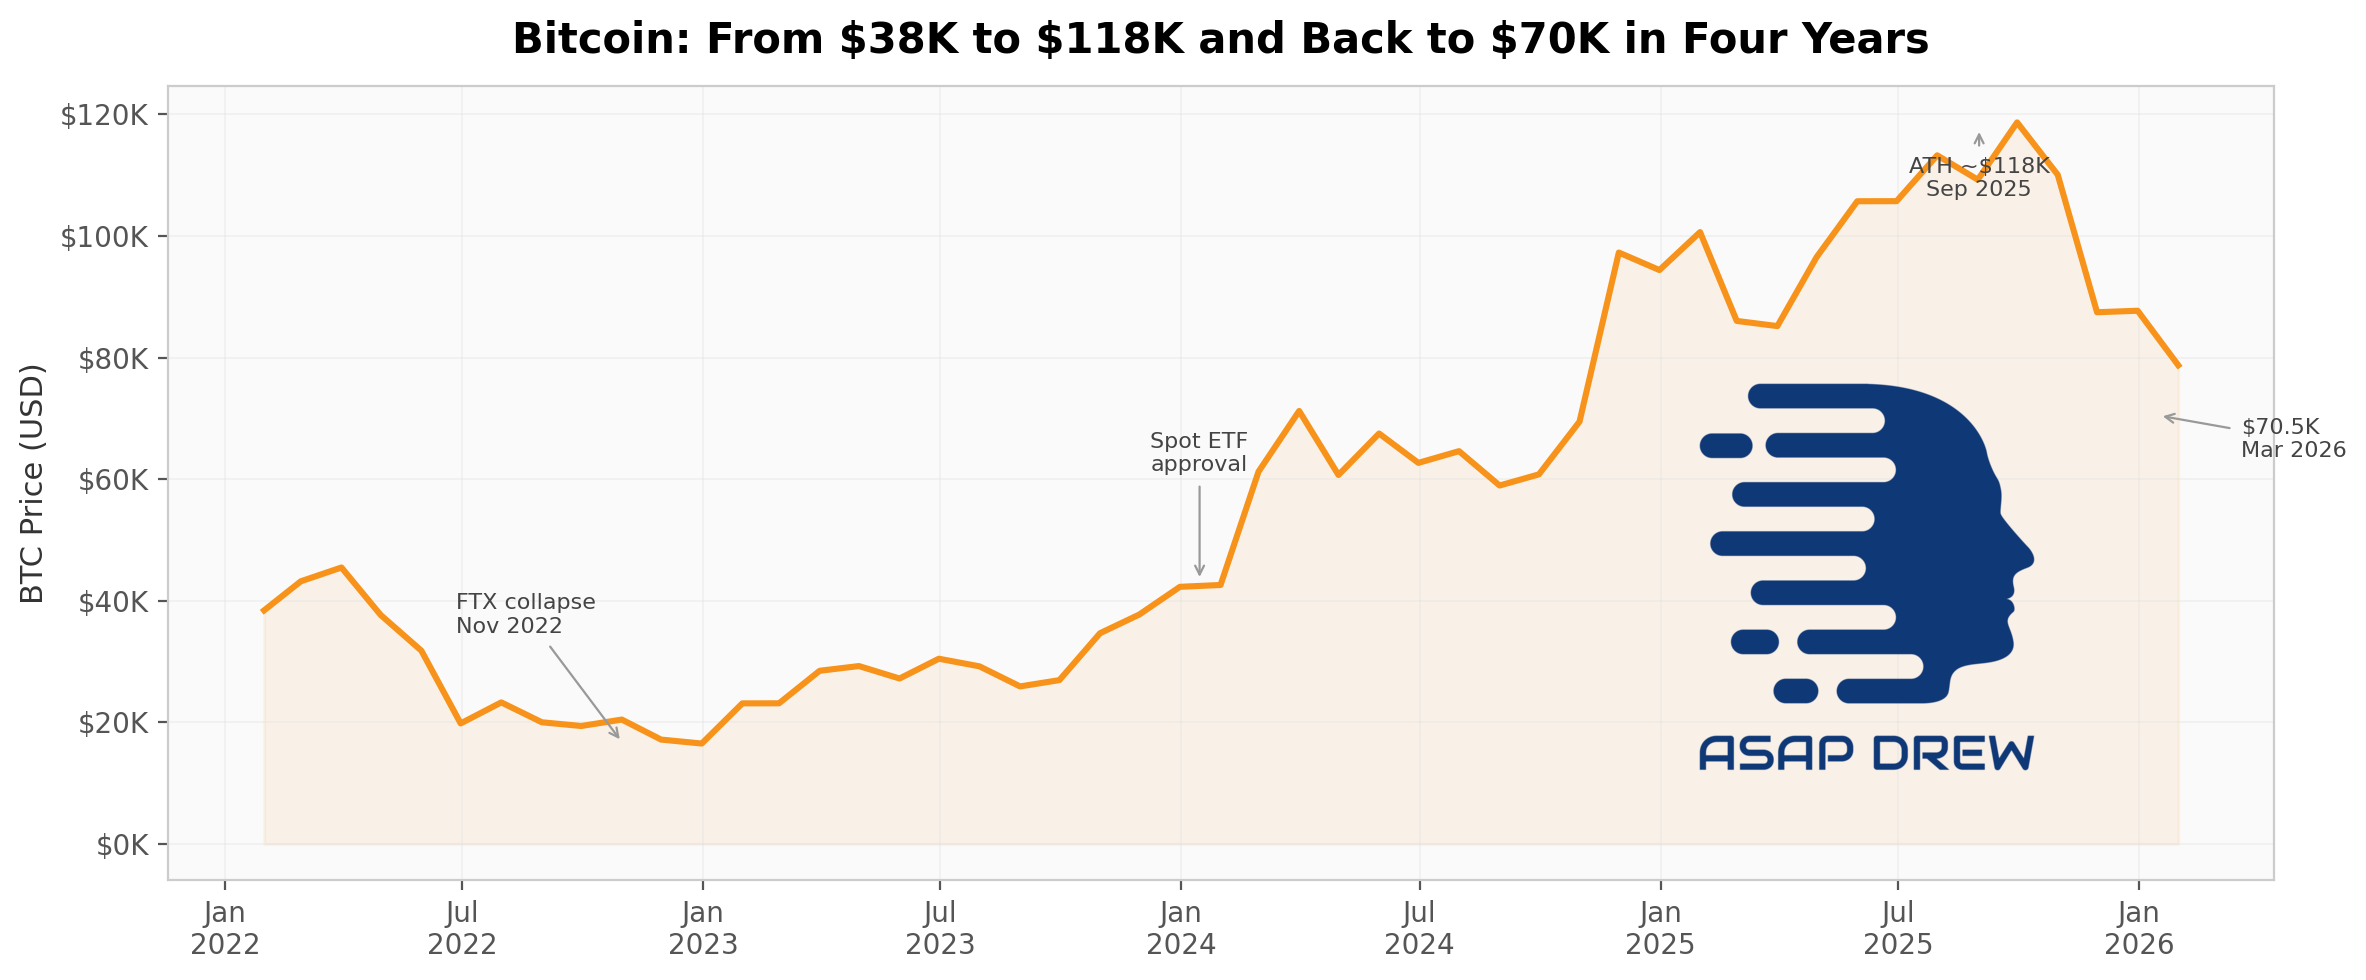
Bitcoin was roughly $70.5K at the time of this analysis. In the month-end BTC series I utilized to align price with published monthly money data, it was down ~40% from a September 2025 month-end peak near $118,000 (Bitcoin’s true spot/intraday ATH was higher — around $126,000 in early October 2025).
Yet since that month-end peak, the G4 global liquidity proxy has kept climbing.
If you’ve been watching the “BTC tracks global M2” charts that have circulated since Lyn Alden’s widely-read Bitcoin: A Global Liquidity Barometer piece, you might be confused.
The money printer line keeps going up. Bitcoin keeps going down. Is the thesis broken?
The short answer: the thesis is still accurate.
But the version many people are running in their heads — draw one global M2 line, expect BTC to mirror it with some lag — does not survive the last two years very well.
The useful version is more specific, more lagged, built on G4 broad money rather than just U.S. M2, and more regime-dependent than the meme suggests.
Here’s what I found.
What I Built and Why
Most of the global liquidity overlays you see on Twitter use U.S. M2 as the anchor, sometimes mixed with a few other countries. The problem isn’t M2 itself — it’s geographic scope. As I’ll show later, U.S. M2 accounted for only 9% of G4 liquidity growth over the past year. Watching it alone means watching a small fraction of the signal.
One related note: the Fed’s 2020 H.6 revision pulled savings deposits into M1, adding roughly $11.2 trillion overnight while leaving M2 unchanged. Post-2020 M1 now behaves more like old M2, which is why I avoided it entirely and built the composite on broad money measures instead.
Instead, I constructed two proxies from scratch.
The first is a USD-converted broad-money composite of U.S. M2, euro area M3, China M2, and Japan M3 — the G4 blocs that collectively account for the vast majority of global money.
The second is a local-currency quantity-only index of the same four series, which strips out FX translation effects so I could check whether dollar strength was doing all the work.
The USD liquidity proxy sums nominal broad-money stocks after USD conversion and rebases the total to January 2022 = 100; the local-currency version tracks the same blocs without dollar translation to isolate quantity effects from FX effects. Because the money data are monthly, all BTC/liquidity overlays and lag tests use month-end BTC values unless otherwise noted.
BTC prices come from the Coinbase/FRED monthly series, extended to current spot.
The panel runs from January 2022 through January 2026, the latest month where all four money supply series have been published. That gives me 49 monthly observations — enough for exploratory lead/lag tests, but not enough to claim stable laws.

The Headline Correlation Is Real — But Misleading
Alden reported a 0.94 BTC-to-global-liquidity correlation over May 2013 to July 2024, with directional consistency of 83% over 12-month windows and 74% over 6-month windows.
Those are strong numbers.
In my updated sample, the level correlation is still high: 0.86 for the USD-converted proxy and 0.85 for the quantity-only version. Both series trend upward over time, and so does BTC — so far, so good.
But because both series are non-stationary and trending, the levels correlation should be treated cautiously; the more useful signal is in lagged changes, not the raw overlay.
Here’s where it breaks down. When I look at contemporaneous changes instead of levels, the relationship nearly vanishes:
Same-month 1-month changes: correlation of 0.04 (basically zero)
Same-month 3-month changes: 0.28
Same-month year-over-year changes: -0.06
That is the key finding.
The headline correlation is real, but a meaningful part of it is a shared trend, not a same-month trading signal.
If you’re using a global M2 overlay as a timing tool for what BTC does this month, the data say you’re mostly trading noise.
The Signal Is in the Lag
The relationship improves materially once you let liquidity lead BTC by a few months.
This is what many people get wrong.
They expect simultaneous tracking, when the actual transmission mechanism takes time.
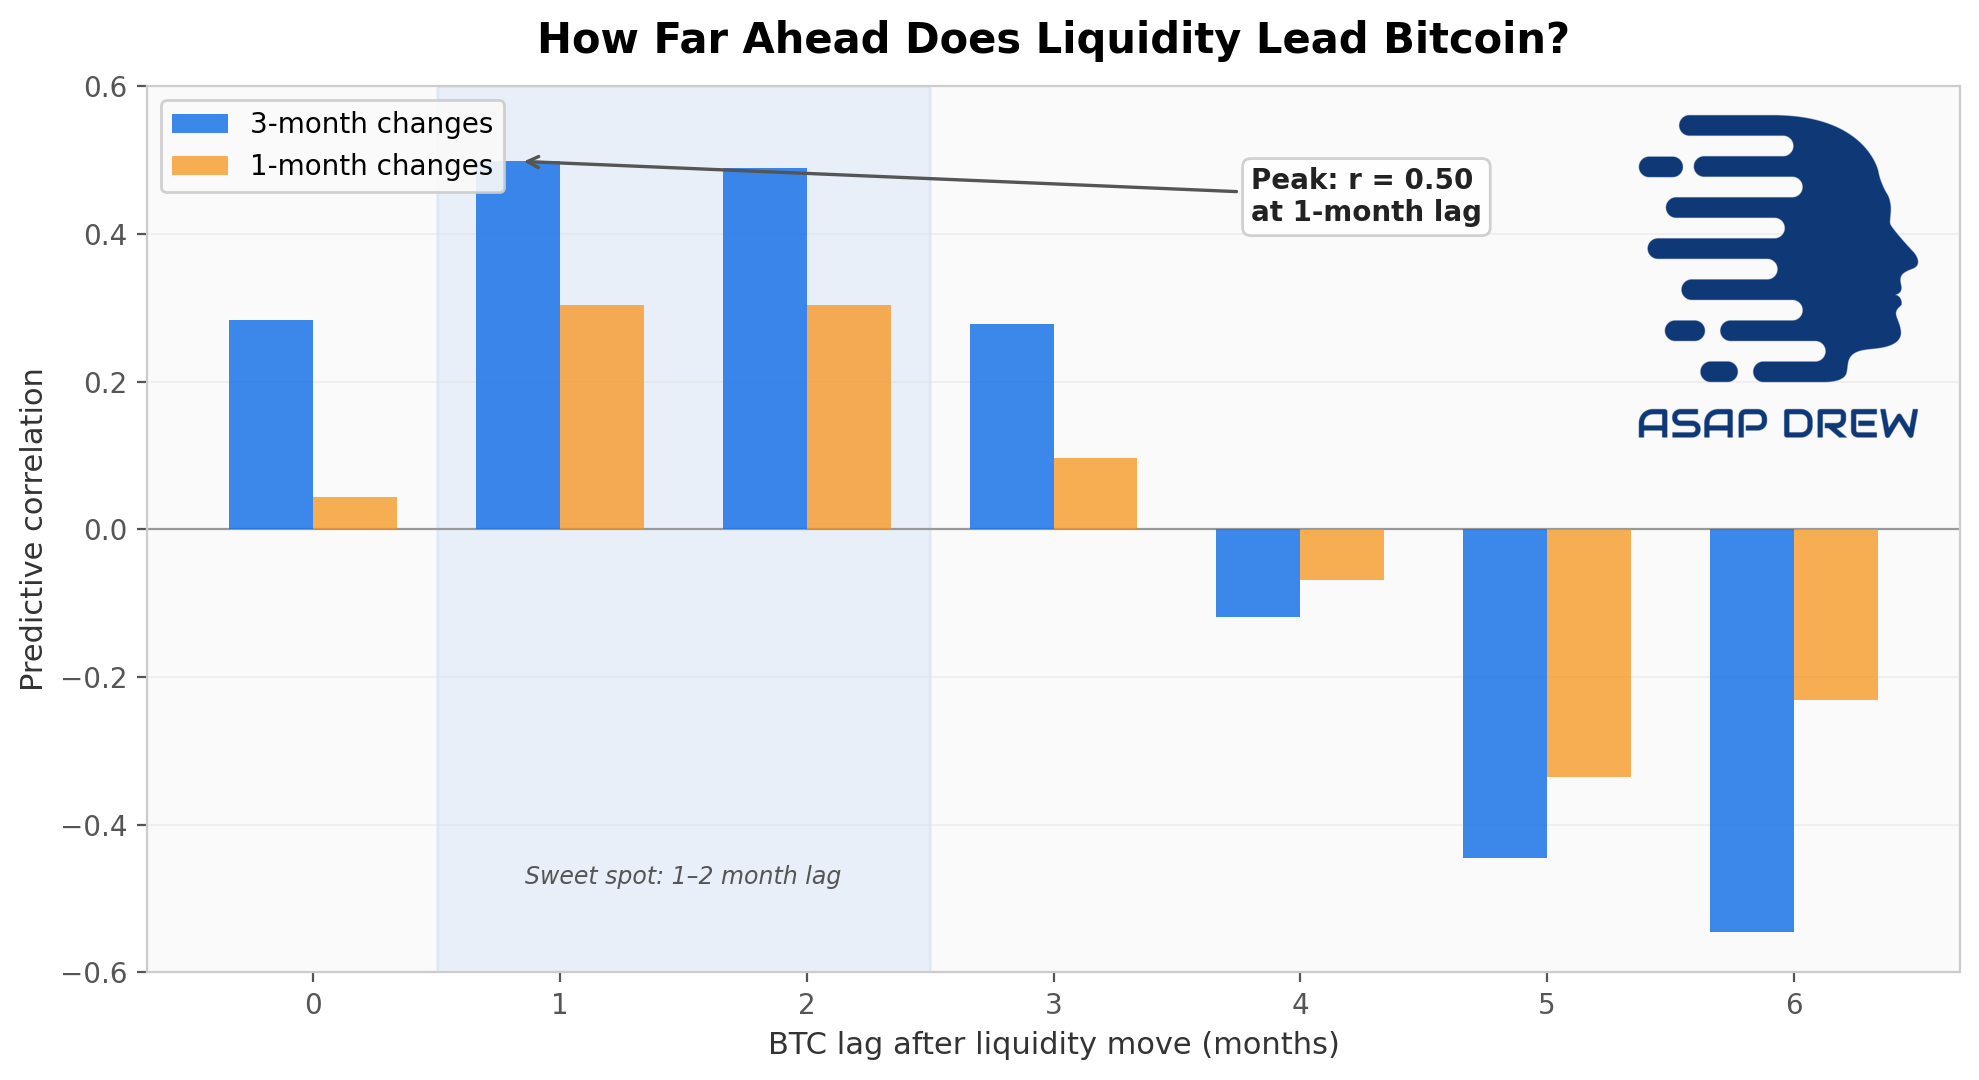
When I tested the predictive correlation between a 3-month liquidity change and a future BTC 3-month return across different lags, the peak hit roughly 0.50 at a 1-month lag and 0.49 at a 2-month lag.
By 3 months the signal has faded to about 0.28, and beyond 4 months it flips negative (likely a mean-reversion artifact from the small sample).
An exploratory Granger-style test suggests the direction runs from liquidity → BTC: significant at 1–2 lags (p ≈ 0.04), while the reverse (BTC → liquidity) is not supported in this sample.
Bitcoin does not appear to lead global liquidity in any useful way — it follows it, with a delay. And my central estimate for the lag is ~2 months, with a realistic band of 1 to 3 months.
The Lag Is Shifty
One of the more interesting findings is that the optimal lag is not constant.
In rolling 18-month windows over the last two-plus years, the best-fit lag has shifted:
Early 2024: mostly 1–2 months
Mid-2024: briefly compressed toward 0–1 month (around the ETF-driven rally)
Late 2025 through January 2026: widened back toward 2–3 months
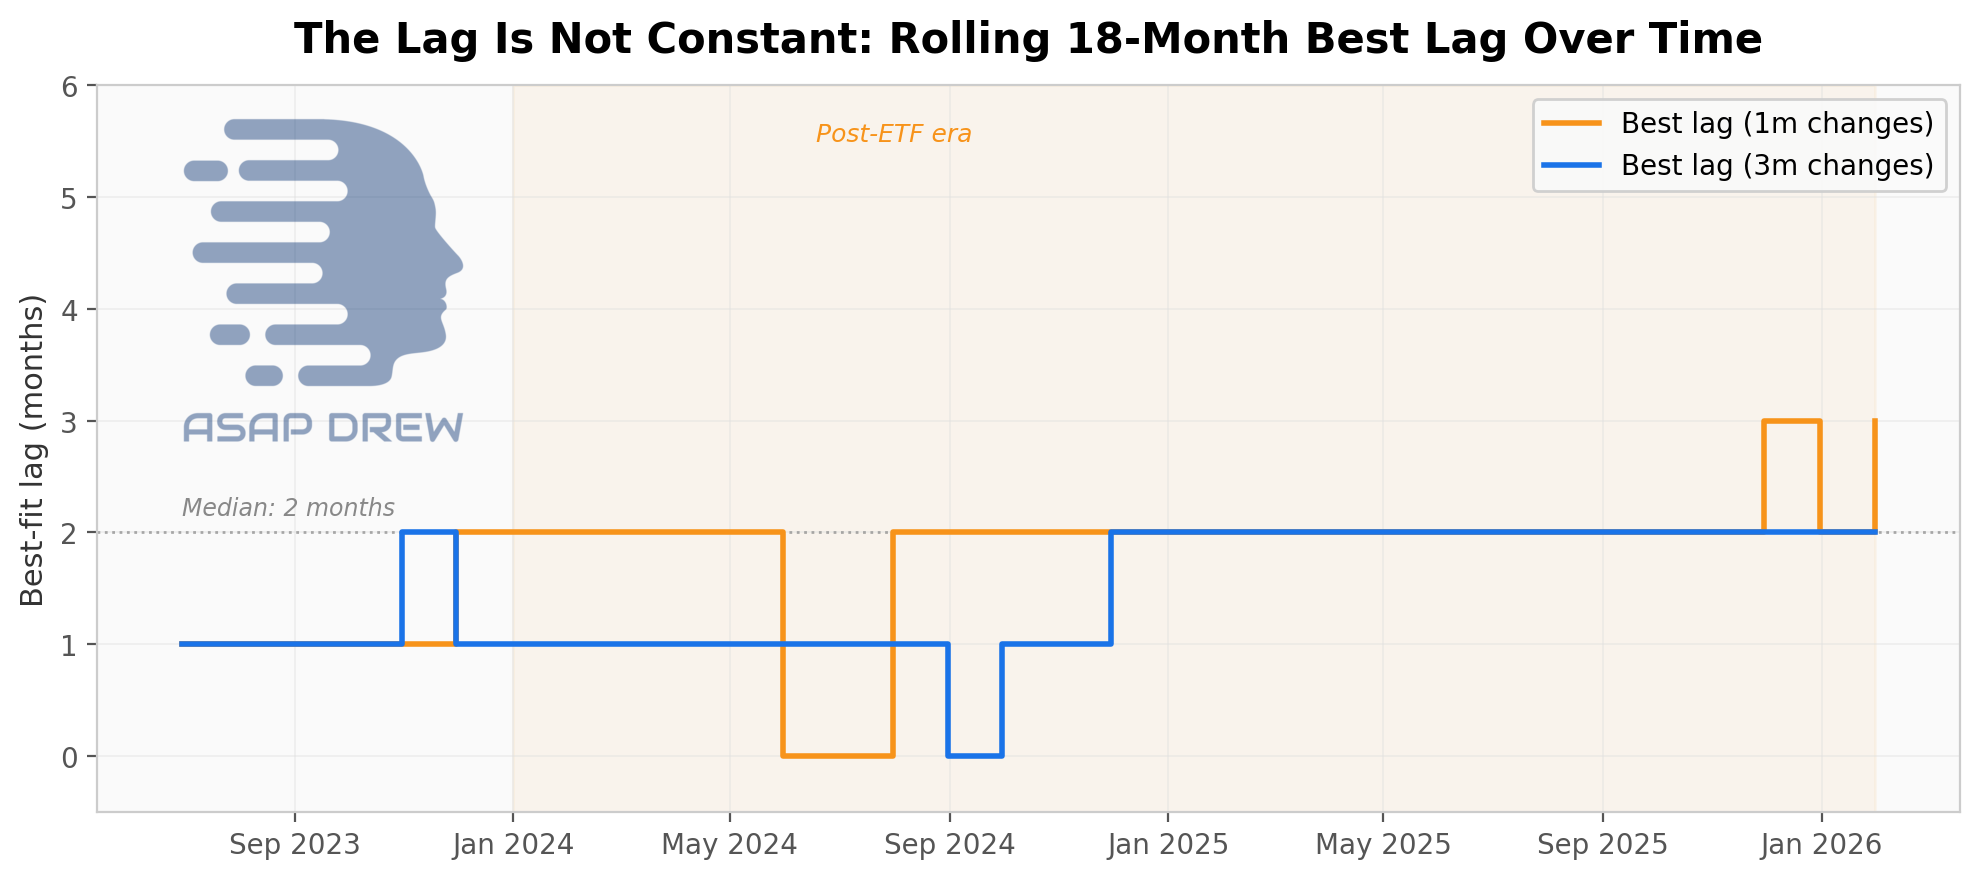
The rolling mean lag across the full window is about 1.9 months using 1-month changes and 1.6 months using 3-month changes.
The median is 2 months either way.
The instability matters: any model that assumes a fixed lag will periodically look brilliant and periodically look broken.
The Magnitude: Not a Fixed Beta
On the question of “how many percent does BTC move per percent of liquidity change” — there is a usable estimate, but it is not a stable law.
In the 2024–2026 subsample, a 1% rise in the USD-converted liquidity proxy over 3 months corresponded to roughly +4.2% BTC over the next month or +6.6% BTC over the next 3 months.
The standalone correlation there is about 0.42, R² about 0.17–0.18, and next-quarter sign agreement about 68%.
The full 2022–2026 sample gives a wider range: the beta on 3-month liquidity changes predicting 3-month BTC returns is about 3.2x with an R² of only 0.08.
In other words, the relationship is real but explains less than a fifth of BTC’s variance in any given quarter.
The right mental model is “a positive liquidity impulse usually gets multiplied in BTC over the following quarter,” not “1% liquidity always equals X% BTC.”
Why It Broke in 2025–2026
By January 2026, the USD-converted liquidity proxy was growing about 12% year-over-year. BTC was down about 22% year-over-year.
That’s a massive divergence — and it has a specific explanation.
Market structure changed. The SEC approved spot bitcoin ETPs in January 2024, which made institutional ETF flows a much more important transmission channel between macro conditions and BTC price. When those flows reverse, they can overwhelm the slower broad-money signal for months at a time.
And reverse they did. U.S. spot BTC ETFs saw more than $3 billion in outflows in January 2026, following heavy outflows in November and December 2025. Post-ETF bitcoin can temporarily trade like a macro-sensitive institutional product with large flow shocks — not just like a pure liquidity beta.
At the same time, the wave of corporate bitcoin treasury plays — led by Strategy (formerly MicroStrategy) and a growing list of imitators — had become a crowded trade by late 2025, with many of these companies overextended on convertible debt and equity issuance.
When BTC softened, their stock premiums compressed and the marginal buying pressure that had amplified the 2024–2025 rally flipped from tailwind to headwind.
The other piece of the puzzle is the price of liquidity vs. the quantity.
Global money supply is growing, but that money is more expensive. Oil has surged roughly 40% since the Iran conflict escalated, the U.S. 2-year Treasury yield has risen nearly 30 basis points, and futures have pushed the expected first Fed cut from June toward September.
The ECB is warning that the oil shock creates upside inflation risk. The BOJ keeps tightening. The quantity of money is up; the cost of accessing it is also up.
BTC is caught in the middle.
Who Is Actually Driving Global Liquidity?
Not everyone is contributing equally. When I decomposed the January 2025 to January 2026 growth in the USD-converted proxy:
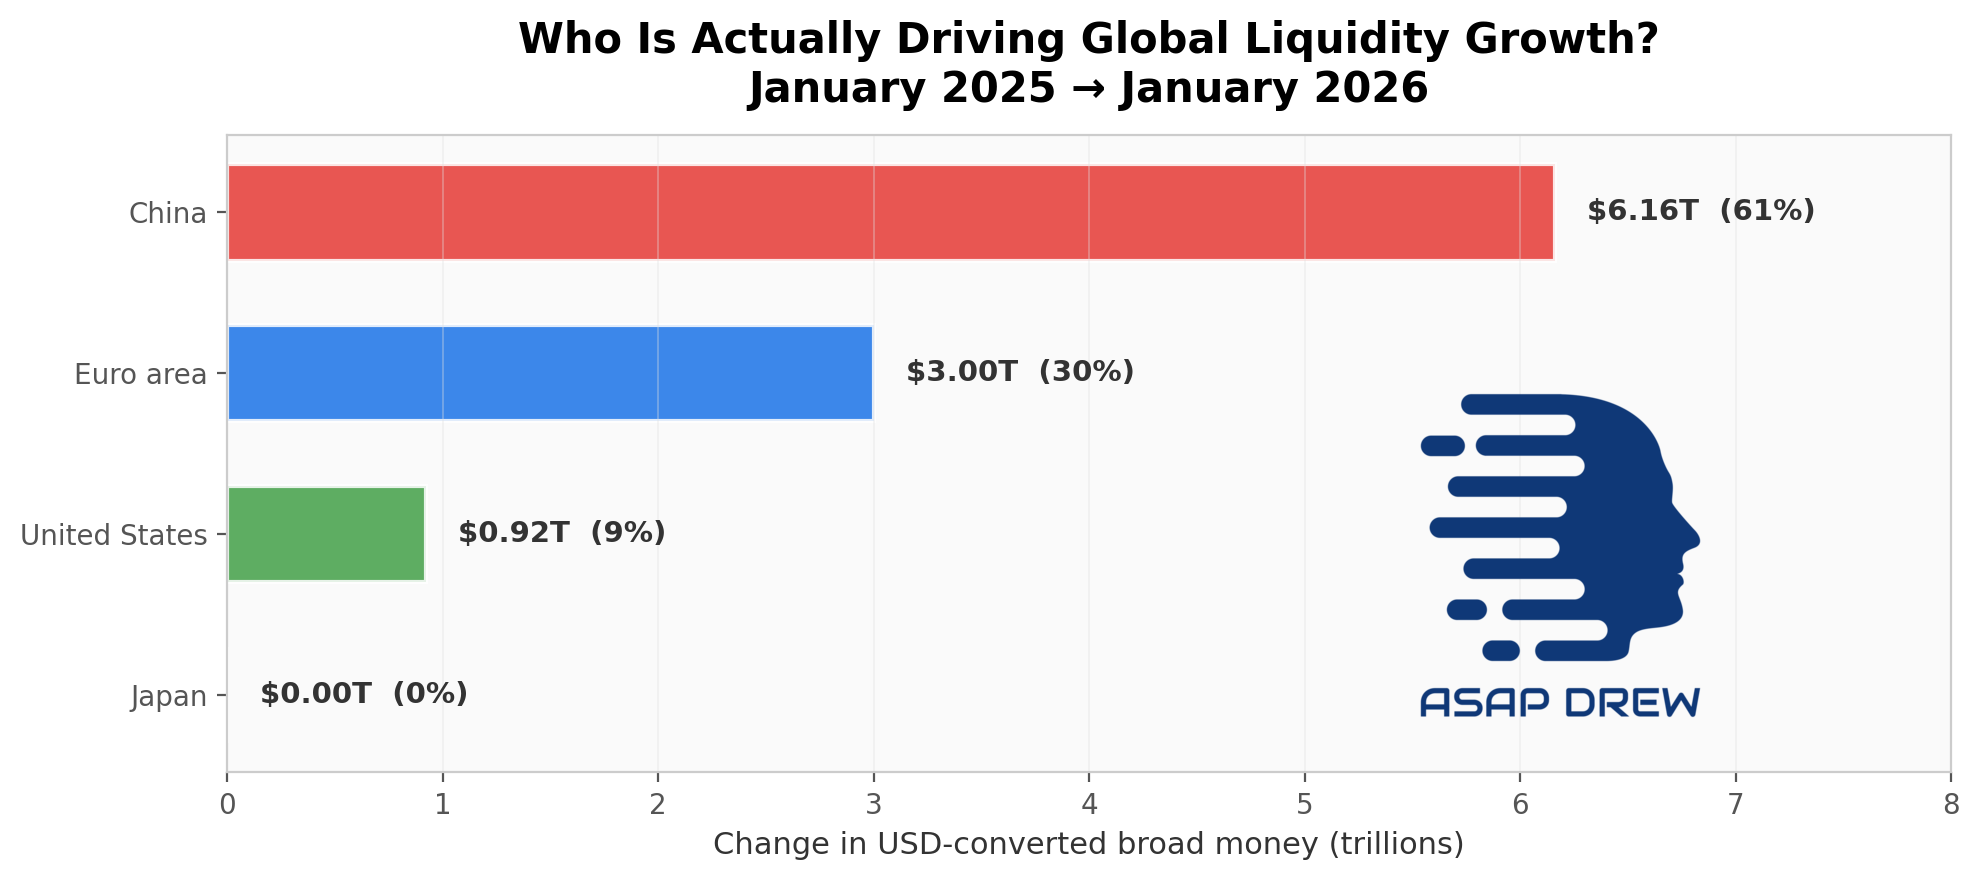
China: 61% of the increase ($6.16 trillion in USD terms)
Euro area: 30% ($3.00 trillion)
United States: 9% ($0.92 trillion)
Japan: essentially zero
If you’re tracking U.S. M2 alone, you’re watching 9% of where the G4 liquidity growth actually came from over the past year.
This matters because BTC trades on the marginal dollar and liquidity impulse, not just nominal global money quantity. Chinese M2 growing at 9% y/y is the biggest current liquidity tailwind, and the PBOC has signaled more RRR and rate cuts ahead. But Chinese broad money expansion does not flow into BTC markets with the same directness as U.S. dollar liquidity. It’s supportive, not sufficient.
A Composite Scoring System In 2026
If I had to distill this into a single scoring system, I’d normalize the inputs and weight them roughly as follows. The weights below are pragmatic judgment weights, not coefficients from a fully specified regression — treat this as a framework, not a backtest.
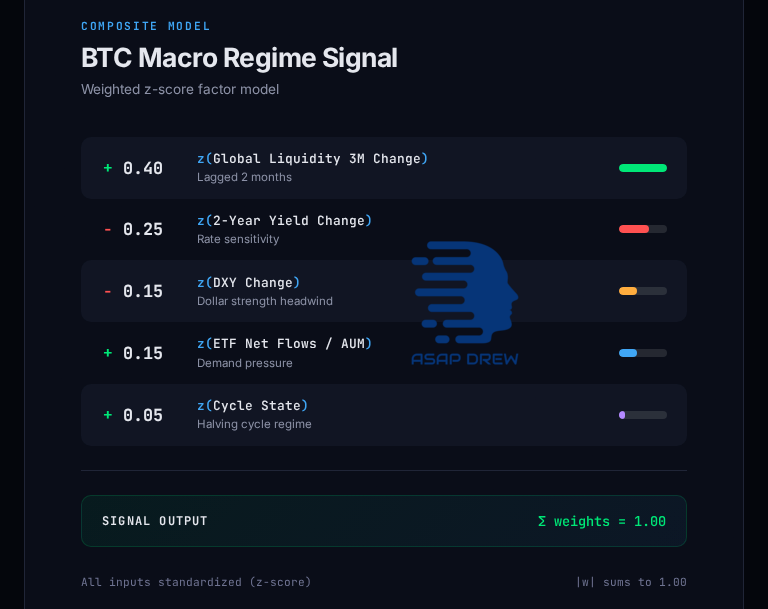
BTC 6-month score =
+ 0.40 × z(global liquidity 3m change, lagged 2 months)
− 0.25 × z(2-year yield change)
− 0.15 × z(DXY change)
+ 0.15 × z(ETF net flows / AUM)
+ 0.05 × z(cycle state)
The raw rule of thumb behind that weighting: when rates, the dollar, and flows are all neutral, 1% more global liquidity over a quarter is worth roughly 5–7% more BTC over the following quarter.
Right now I’d haircut that beta because yields, oil, and the dollar are all working against it.
The best rough tools for BTC, in order of usefulness:
FX-adjusted global liquidity impulse — best medium-term signal, 1–3 month lead
ETF net flows — best short-term signal, 0–2 week lead
Front-end rates and the dollar — same-day to 1-month transmission
Oil/geopolitical shocks — because they move #2 and #3
Cycle-state filters — valuation sanity checks, not timing tools
Where This Points Forward
The current macro mix is positive on money quantity, mixed on transmission.
U.S. M2 is up 4.3% y/y, euro area M3 up 3.4% y/y, China M2 up 9.0% y/y, Japan M3 up 1.2% y/y.
But the Fed is still at 3.50–3.75%, the ECB is at 2.00/2.15/2.40%, the BOJ is at 0.75% and still tightening, and the PBOC is the only major central bank in full easing mode.
The demographic backdrop reinforces the long-run case. The OECD projects the old-age dependency ratio across member countries will rise from 33 today to 55 over the next thirty years, while the working-age population falls by 8%.
My inference: aging populations keep long-run pressure toward easier nominal settings, but also toward stickier services inflation. That means “stop-start” liquidity cycles — not one giant synchronized easing wave.
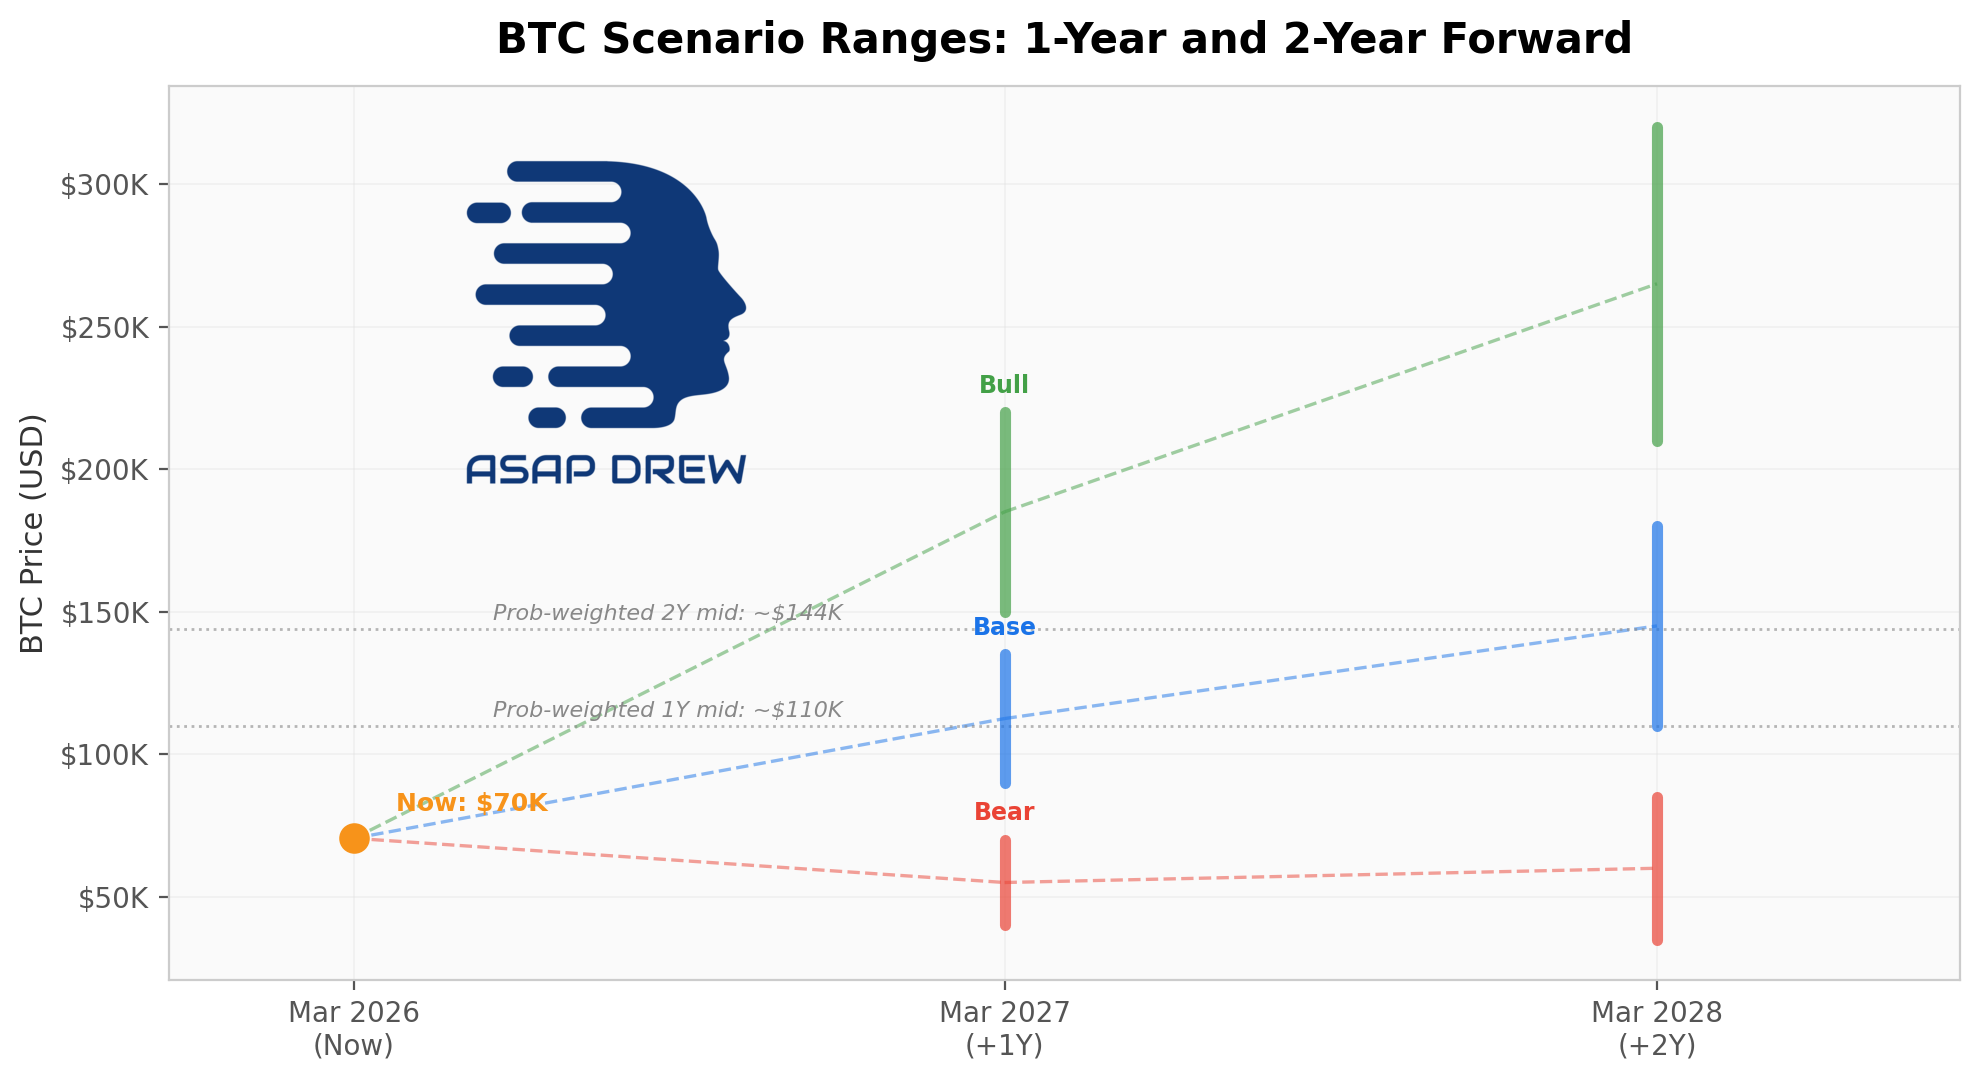
My scenario-based forecast from current spot (~$70.5K):
Base case (50% probability) — $90K–$135K in 1 year, $110K–$180K in 2 years. Oil normalizes, the liquidity impulse transmits with its usual lag, ETF flows stabilize. The correlation continues but with more noise than Alden’s long sample suggests. BTC stays choppy near term, then improves on a 6–12 month horizon. Confidence: medium.
Bull case (20%) — $150K–$220K in 1 year, $210K–$320K in 2 years. The oil shock fades, the Fed cuts by mid-to-late 2026, front-end yields and the dollar roll over, the PBOC eases further, and ETF inflows resume. The liquidity/BTC link tightens and BTC resumes a strong uptrend. Confidence: medium-low.
Bear/stagflation case (30%) — $40K–$70K in 1 year, $35K–$85K in 2 years. Oil stays high, the Fed and ECB hold longer or turn more hawkish, the BOJ keeps tightening, and ETF outflows persist. BTC keeps underperforming headline global liquidity because the price of money stays too high. Confidence: medium-low.
Probability-weighted midpoint: ~$110K in 1 year (+56%) and ~$144K in 2 years (+104%). The wide ranges reflect what the current macro setup is actually doing: cutting in opposite directions across regions and instruments.
The Verdict on Alden’s BTC as a Liquidity Barometer Thesis
Alden’s thesis holds up. Her “Bitcoin as a global liquidity barometer” framing is correct over the medium term — and her emphasis on directional consistency over 6–12 month windows, rather than same-month tracking, is exactly what my data confirms.
The thesis works best when the liquidity proxy is USD-aware, multi-bloc, and lagged about two months. It works worst when ETF flows, oil shocks, rate repricing, or BOJ normalization dominate the tape.
I would not use a single global-M2 line as a timing tool. But I would still rank properly defined global liquidity as one of the best medium-term state variables for bitcoin.
The signal is alive. It is just lagged, regime-dependent, and increasingly filtered through institutional flow channels that didn’t exist two years ago.
The Five Things Worth Remembering
For long-term accumulators of BTC, this means G4 liquidity surges can serve as a timing signal for when to add — you typically have a 1–3 month window before BTC catches up.
For short-term traders, the signal is too noisy and the lag too unstable to use as a standalone entry/exit rule.
The current setup is a case in point: G4 liquidity is up 12% y/y while BTC is down 22% y/y. Historically, divergences of that magnitude have tended to close over the following quarter — which is why the base case skews positive on a 6–12 month view.
The correlation is real but lagged. Global liquidity leads BTC by roughly 1–3 months, centered around 2. Same-month tracking is noise.
The magnitude is roughly 5–7x. In a neutral rate/dollar/flow environment, 1% more global liquidity over a quarter has corresponded to roughly 5–7% more BTC over the following quarter. That beta is not stable and should be haircut when yields and the dollar are working against it.
ETF flows changed the game. Post-January 2024, institutional flow shocks can overwhelm the liquidity signal for months at a time. The transmission channel now runs through a new institutional plumbing layer that can amplify or suppress the signal.
China is doing the heavy lifting. Over 60% of the past year’s G4 liquidity growth came from China, but Chinese broad money does not flow into BTC markets with the same directness as U.S. dollar liquidity. The composition of liquidity growth matters as much as the quantity.
The current setup is near-term cautious, medium-term constructive. Money quantity is growing, but the price of that money (yields, oil, dollar) is working against BTC right now. If those headwinds fade over the next 6–12 months, BTC has a positive liquidity backdrop to catch up to. If they don’t, the divergence can persist.
These conclusions are drawn from a 49-month panel through January 2026.
They will evolve as new data arrives — particularly around Fed rate decisions, ETF flow trends, and whether the current oil shock proves transitory or entrenched.
DISCLAIMER: Nothing here is financial or investment advice.