
Super Bowl Favorites vs. Underdogs: Who Wins More Often?
Strict betting data suggests Fade the Masses in Super Bowl LX.

I tasked ChatGPT-5.2 with pulling the full Super Bowl point-spread (ATS) history back to Super Bowl I (Jan 15, 1967) through Super Bowl LIX (Feb 9, 2025) from SportsOddsHistory’s Super Bowl table (59 games).
I did not manually audit every line, but I ran a quick sanity check: the dataset contains 59 Super Bowls and the ATS outcomes reconcile cleanly, including 2 pushes (SB XXXI and SB XXXIV). Treat this as a strong historical summary, not an audited sportsbook ledger.
Important limitation: Precise historical moneyline (ML) odds are unknown.
Archives contain point-spreads (ATS outcomes), so for “moneyline” performance, ChatGPT evaluated the straight-up (SU) result of the point-spread favorite (i.e. Did the spread-favorite win the game outright?)
If you need specific moneyline odds data (e.g. Chiefs -124 vs. Eagles +106) to analyze moneyline ROI — you can probably find most odds for the recent modern era, but digging up accurate odds all the way back to Super Bowl I is unlikely… we’d need a separate moneyline archive dataset.
Line source: SportsOddsHistory Super Bowl closing spreads (I–LIX).
Favorite: The team with the negative spread.
SU (“straight up”): Did the spread favorite win the game outright?
ATS: Did the favorite cover the closing spread?
Pushes: Excluded from ATS cover-rate denominators.
Historical Record: Picking the Favorite to Win Every Super Bowl
Using the listed Super Bowl closing spreads and ATS outcomes.
Moneyline (straight up):
Favorites won 37 of 59 Super Bowls → 62.7% win rate.
Underdogs won 22 of 59 → 37.3%.
ATS (against the spread):
Favorites covered 28
Underdogs covered 29
Pushes: 2 (SB XXXI: Packers -14 + SB XXXIV: Rams -7).
Favorite cover rate (excluding pushes): 28 / 57 = 49.1%
So your “hit rate” if you blindly picked the favorite every time:
SU hit rate: ~62.7%
ATS: ~49.1% (with 2 pushes / no-decision)
Context: ATS bets priced around -110 generally require ~52.4% to break even, so “favorite ATS every Super Bowl” is below breakeven on hit rate alone.
Era analysis
I had ChatGPT do specific analyses of eras tied to major league shifts that plausibly affect parity and scoring environments.
Examples: Evolution of the Rules; Free Agency; Illegal Contact Crackdown.
1978 pass-game shift: illegal contact restricted beyond 5 yards and pass-blocking interpretations loosened, explicitly intended to open the passing game.
1994 salary cap (post-1993 free agency settlement): cap introduced as an “equalizer” in response to free agency.
2004 illegal contact emphasis/crackdown: widely cited as accelerating the passing-friendly environment.
Era summary (favorite performance)
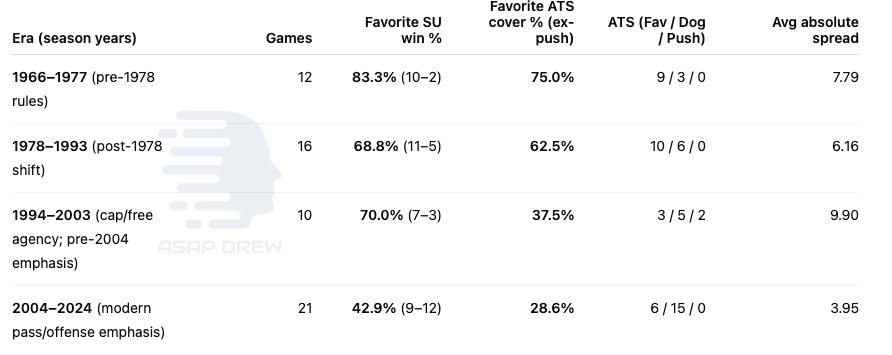
What jumps out?
Favorites dominated early (especially pre-1978): Both SU and ATS.
The modern era (2004–2024) is the opposite:
Favorites won outright less than half the time (9–12 SU).
Favorites covered only 6 of 21 Super Bowls ATS (28.6%).
Spreads are also much smaller on average (about 4 points), which mechanically means “favorite” often just means “slightly better team,” not a true mismatch.
Finer look inside the modern era
Because “2004–2024” is large, here’s a simple 7–7–7 split:
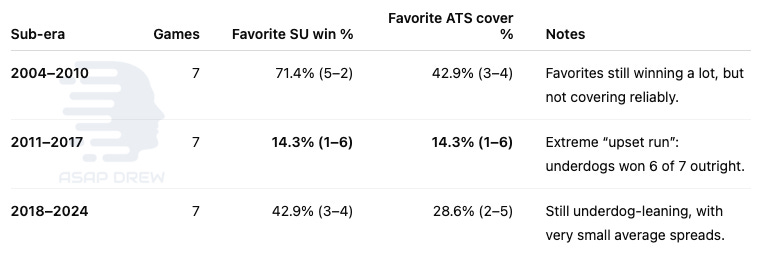
That 2011–2017 stretch is doing a lot of work in dragging down “modern favorites” overall.
Current-ecosystem check: 2011+ (and 2018+) is arguably more relevant than 2004+
The “modern era (2004–2024)” is not one uniform regime.
The NFL’s 2011 CBA/practice environment and several 2018+ enforcement/rule clarifications, plus major 2024–2025 changes (kickoff and OT), justify running sensitivity cuts.
Why 2011 and 2018 are credible breakpoints (not just arbitrary slicing):
2011 CBA changed the team-building/training ecosystem (notably reducing offseason/practice time; eliminating traditional two-a-days; and implementing the modern rookie wage scale structure). (R)
2011 kickoff moved to the 35 (field-position / return environment shift). (R)
2018 catch rule simplified (what counts as a catch). (R)
2018 roughing-the-passer “body weight” enforcement became a major point of emphasis (QB protection / how defenders finish sacks). (R)
2024 hip-drop tackle ban (another defensive constraint). (R)
2024 “Dynamic Kickoff” introduced; made permanent with modifications in 2025 (special teams structure). (R)
2025 OT alignment: Both teams get an opportunity to possess the ball even after an opening TD (regular season). (R)
What the base rates look like under these “current ecosystem” cuts:
2004–2024: Underdogs won 12/21 SU (57.1%) vs. covered 15/21 ATS (71.4%).
2011–2024: Underdogs won 10/14 SU (71.4%) vs. covered 11/14 ATS (78.6%).
2018–2024: Underdogs won 4/7 SU (57.1%) vs. covered 5/7 ATS (71.4%).
Interpretation: The most consistent “current-era” signal is underdogs covering ATS; underdogs winning outright is directionally favored in some recent slices, but it’s a weaker (noisier) signal than ATS because the sample is small.
Practical interpretation (what these results actually mean)
Blind “favorite moneyline” beats coin flip historically (62.7%).
However:
Without moneyline prices, you can’t conclude profitability, only correctness rate.
A 62.7% hit rate corresponds to a “break-even” uniform price of about -168 on average (illustrative only).
Blind “favorite ATS” is basically a coin flip overall (49.1% ex-push) and is very poor in the modern era (28.6% since 2004).
The most consistent structural driver visible in the data is that Super Bowls have become tighter-priced games (smaller spreads), which naturally compresses favorite win rates and boosts underdog covers.
Note: Super Bowls are one game per year, and the “favorite” is often only a marginal favorite; slicing into sub-eras improves relevance but also makes samples smaller—so treat these as directional base rates, not laws.
Based on era-specific winner trends (favorites vs. underdogs) who is the best bet in Super Bowl LX?
The market has Seattle as the favorite.
Spread: Seahawks -4.5 vs Patriots +4.5 (R)
Moneyline (typical current screen): Seahawks around -230, Patriots around +190 (R)
If you force the decision solely from “what’s been most likely in the current modern Super Bowl era” (i.e., ignoring team matchups and using only the historical base rate from Super Bowl point-spread history), what should we pick?
The base-rate pick (modern era)
In the modern passing/offense era (2004–2024 Super Bowls), the underdog has been the more frequent winner.
Straight up (SU): underdogs won 12 of 21 (57.1%)
ATS: underdogs covered 15 of 21 (71.4%)
If you put more weight on the most recent chunk (2011–2024 Super Bowls), it’s even more underdog-skewed.
SU: underdogs 10 of 14 (71.4%)
ATS: underdogs 11 of 14 (78.6%)
Even more “precise” to this line: favorites around -4.5
When the Super Bowl favorite has been in the -3.5 to -5.5 range (like Seahawks -4.5) during the modern era, underdogs have done very well (small sample, but it’s the closest analog):
SU: underdogs 4 of 6 (66.7%)
ATS: underdogs 5 of 6 (83.3%)
Which Super Bowls are in the ‘-3.5 to -5.5 favorite’ bucket (2004–2024)?
SB XL: Steelers -4 vs Seahawks (favorite won & covered)
SB XLIV: Colts -4.5 vs Saints (underdog won & covered)
SB XLVII: 49ers -4.5 vs Ravens (underdog won & covered)
SB 50: Panthers -5 vs Broncos (underdog won & covered)
SB LII: Patriots -4.5 vs Eagles (underdog won & covered)
SB LVI: Rams -4.5 vs Bengals (favorite won; underdog covered)
The trend suggests picking the Pats
Seattle is favored (-4.5).
The Patriots are the underdog.
The trend-only base-rate pick (stronger signal): Patriots +4.5 (ATS)
Trend-only corollary (weaker signal): Patriots moneyline (underdogs have won outright more often in some recent slices, but the SU edge is noisier than ATS)
That’s the direction most consistent with the modern-era Super Bowl outcomes (dogs > favs SU and ATS).
Caution: This is a trend-only approach with small sample sizes, and the spread/moneyline already reflect a lot of information (and include vig), so it’s not a guarantee — just the historical “most likely” side given this constraint.
DISCLAIMER: NOTHING HERE IS GAMBLING/BETTING ADVICE.