Reparations for Slavery in the United States: The Debt Was Already Paid
Many are now advocating for reparations for slavery... to be paid to people who were never slaves... from people who never owned slaves... in states that never had slavery!

The contemporary political landscape in the United States is increasingly dominated by calls for “reparations” — a federally mandated transfer of wealth from the general treasury to African American descendants of enslaved persons.
This demand is predicated on the assertion of an unpaid debt: a moral and financial deficit generated by two and a half centuries of chattel slavery and a subsequent century of de jure segregation.
Proponents argue that the wealth gap between White and Black Americans is the direct, unmediated result of this history, and that “repair” requires a massive, explicit capital injection.
Here I present a counter-analysis. It posits that the “debt” of slavery, while undeniably grievous in its historical origin, has not only been paid but overpaid through a complex, multi-generational web of “implicit reparations.”
By conducting a forensic audit of the American fiscal system, social policy, and historical record, this analysis demonstrates that the flow of resources has been heavily skewed in favor of the black community for at least the last 60 years.
When one aggregates the $22 trillion expended on the War on Poverty (a program with disproportionate minority beneficiaries), the trillions in opportunity costs and efficiency losses generated by Affirmative Action and Diversity, Equity, and Inclusion (DEI) mandates, the direct subsidies provided through the tax code and educational grants, and the staggering economic burden of violent crime and social disorder imposed on the polity, the ledger shifts dramatically.
The United States has engaged in a de facto reparations program of unprecedented scale, functioning through the mechanisms of the welfare state, the regulatory apparatus, and the criminal justice system.
Furthermore, the historical simplifications required to sustain the reparations argument — specifically the binary of “white oppressor” and “black victim” — collapse under scrutiny.
The documented existence of (A) a wealthy black slave-owning class, (B) the ubiquity of indigenous slavery, and (C) the non-complicity of the vast majority of American families (immigrants and non-slaveholders) render the moral claim for racially targeted transfer payments incoherent.
The logistical impossibility of disentangling lineage in a way that prevents the massive fraud seen in previous settlements (e.g., Pigford) further confirms that the reparations project is not a pursuit of justice, but a demand for a permanent, race-based annuity.
The “surplus” in the American racial contract currently resides with the beneficiaries of the transfer state, not the providers. The debt is settled.
I. The Fiscal Ledger: The Welfare State as Implicit Reparations
If you want to claim there is an unpaid “debt,” the first honest step is to open the books and ask what has already been paid out.
Since the mid‑1960s, the United States has run the largest anti‑poverty project in human history.
It is not framed as reparations, but in practice it operates exactly that way: a permanent stream of tax‑funded transfers flowing disproportionately to one small slice of the population.
A) The Scale of the War on Poverty
When Lyndon Johnson declared a “War on Poverty” in 1964, he wasn’t announcing a one‑off program.
He was launching an entire ecosystem of means‑tested benefits: Medicaid, food stamps/SNAP, housing assistance, cash welfare, SSI, school lunch programs, and dozens of smaller schemes layered on top of one another.
Two things matter for the ledger:
How big is this stream?
Who actually rides it?
On the first question, even very cautious estimates are staggering:
The Heritage Foundation calculated that by around 2014, the U.S. had already spent about $22 trillion (in constant 2012 dollars) on means‑tested welfare programs since the War on Poverty began. (Heritage)
Updating that to include more recent years and including state and local programs, the Cato Institute puts total anti‑poverty spending since 1965 at more than $30 trillion. (Cato Institute)
Those figures exclude Social Security and Medicare, which are (in theory) earned social insurance. We’re talking strictly about need‑based transfers.
If you wanted to design reparations without ever using the word, this is what it would look like: a $30‑trillion river of tax money pointed at low‑income populations year after year.
B) Who Cashes the Checks? Black % of Welfare Spending
The second question is where the racial politics come in.
African Americans (Blacks) are about 12–13% of the U.S. population today. If they drew welfare strictly in proportion to their numbers, you’d expect something like 12–13% of the welfare stream to go their way.
That is not what the data show.
Across the major means‑tested programs, Black Americans are consistently over‑represented:
SNAP (food stamps). USDA and advocacy summaries based on 2023 SNAP data show that Black Americans make up about 26% of SNAP participants, roughly double their share of the population. (FRAC)
Medicaid. A 2022 Medicaid awareness campaign (using CMS data) notes that Black Americans are around 13.6% of the population but about 20% of Medicaid enrollees. (Medicaid Awareness)
HUD‑assisted housing. HUD’s own reports on assisted renters find that HUD tenants are “more likely to be Black” than the broader pool of very low‑income renters. (NLIHC) In practice, Black heads of household represent the largest racial group in voucher programs and are heavily concentrated in public and subsidized housing.
SNAP, Medicaid, HUD—these are not edge cases. They are the core pillars of the modern safety net. In every one, Black Americans are drawing benefits at roughly twice their population share.
If you take the Cato‑style $30 trillion total anti‑poverty spend since 1965 and assume, conservatively, that:
Black households have received around 25% of that stream (roughly double their population share, consistent with SNAP and Medicaid data),
… then the implied cumulative transfer is:
0.25 × $30 trillion ≈ $7.5 trillion in inflation‑adjusted welfare benefits to Black households since the Great Society.
Spread over roughly 43 million Black residents today, that’s on the order of $170,000 per person as a crude per‑capita equivalent. (Obviously, real people came and went over 60 years; the point is scale, not literal individual payouts.)
Even if you insist on the older Heritage baseline ($22 trillion instead of $30 trillion) the number is still enormous:
0.25 × $22T ≈ $5.5 trillion in cumulative transfers.
Either way, we are not talking about symbolic gestures. We are talking about multi‑trillion‑dollar flows.
C) Program‑Level Proof: Housing, Food, Health Care
To keep this grounded, it’s worth spelling out what those big aggregates mean in day‑to‑day terms.
Housing: The Rent Subsidy
HUD’s assisted housing programs (public housing, vouchers, project‑based Section 8) exist almost entirely for households who cannot pay market rent. Analyses of HUD data show:
HUD‑assisted renters are poorer, older, and more likely to be Black than other very‑low‑income renters. (NLIHC)
The exact percentages vary by year and program, but the structure is the same: White and Asian taxpayers, plus a smaller share of higher‑earning Black and Hispanic taxpayers, finance a system in which Black households are over‑represented in the beneficiary pool.
Shelter is most people’s largest expense. When the state covers a big chunk of that bill through HUD, that is a very direct, very concrete transfer.
Food: SNAP as Permanent Emergency
On food stamps:
USDA and think‑tank summaries of SNAP “Characteristics” reports for FY2022–2023 show that Black Americans are roughly 26% of SNAP participants, versus ~13% of the population. (FRAC)
Again, that doesn’t mean most Black people are on SNAP. It means that among those receiving government food aid, Black Americans punch far above their population weight, year after year.
Health Care: Medicaid as a Parallel Insurance System
Medicaid and CHIP form a second health‑care system underneath the employer/Medicare layer, covering about one in three children and nearly 30% of the population at some point in a given year. (Medicaid)
Within that system:
Black Americans are around 13–14% of the population but about 20–21% of enrollees. (Medicaid Awareness)
Medicaid is not cheap.
Total expenditures (federal + state) are on the order of hundreds of billions per year; in recent years roughly $800–900 billion annually. (Cato Institute)
If Black Americans consistently make up about one‑fifth of enrollees, that implies well over $150 billion per year in medical spending flowing to Black beneficiaries through Medicaid and related programs — a stream funded by general taxation, not by premiums they personally paid.
D) Net Fiscal Impact: Who Pays and Who Receives?
The welfare‑state numbers tell you where explicit benefits go.
To get a cleaner ledger, you also need to look at net fiscal impact: all taxes paid minus all benefits received over a lifetime.
Heritage’s detailed work on low‑skill households found:
Households headed by someone without a high school diploma receive on average about $32,000 in benefits and services per year while paying about $9,700 in taxes, for a net fiscal deficit of roughly $22,000 per household per year. (Heritage)
That is, for each such household, other taxpayers are effectively writing a $22k check every year just to keep the system balanced.
The Congressional Budget Office, from a very different political angle, tells essentially the same story at the income‑quintile level:
The bottom income quintile pays almost no federal income tax, receives substantial means‑tested transfers, and ends up with a strongly positive net flow from the Treasury after taxes and transfers. (CBO)
Overlay the racial data:
Black households are disproportionately concentrated in the bottom income quintiles and in lower education brackets.
White and Asian households are disproportionately in the upper income quintiles and higher education brackets.
Put bluntly: The people who look like “the historical oppressor” in reparations rhetoric are, on the tax ledger, the ones paying in far more than they get back. The group framed as “owed a debt” is, on net, a fiscal beneficiary of the modern American state.
You don’t need to know the exact net subsidy per Black household to see the direction.
Combine:
$30 trillion in anti‑poverty spending over six decades
Black over‑representation in every major means‑tested program
Net fiscal data showing the bottom of the income/education distribution gets far more in services than it pays in tax
… and one conclusion is hard to avoid: as a group, Black Americans have not been “left out” of the welfare state. If anything, they have been first in line.
E) Social Security & Medicare: The “Earned” Programs That Still Tilt Downward
So far I’ve kept Social Security and Medicare off the ledger on purpose. They’re not supposed to be welfare; they’re sold as earned insurance: you pay your payroll taxes, you get your benefits in old age.
That’s the theory. In practice, the structure is still a gigantic downward transfer machine – and because of the income distribution, that means another implicit subsidy flowing out of higher‑earning (heavily White/Asian) workers and into lower‑earning (disproportionately Black) workers and retirees.
Scale: This isn’t a side show
Start with how big these “earned” systems actually are:
Social Security paid out about $1.38 trillion in benefits in fiscal year 2023 – roughly 22.5% of all federal spending that year. (Pew)
Medicare spending in 2023 was about $1.03 trillion, around 21% of all U.S. health spending. (CMS)
You’re looking at something on the order of $2.4 trillion per year in old‑age and disability benefits plus heavily subsidized health care.
Even if only a slice of that is net redistribution, the dollar amounts are massive.
The formula: built‑in progressivity
Social Security’s benefit formula is explicitly progressive:
In 2025 the formula replaces:
90% of the first chunk of average indexed monthly earnings (AIME),
32% of the middle chunk,
15% of the top chunk. (BPC)
Translation: the poorer you are on a lifetime basis, the higher the percentage of your past wages the system promises to pay you. Higher earners get lower replacement rates.
Concrete example from mainstream policy work:
A single man with average earnings retiring at 65 in 2020 gets about $640,000 in lifetime Social Security and Medicare benefits, while he paid in just under $470,000 in taxes – he comes out ahead by roughly $170,000.
A couple with one average and one low‑wage earner gets about $1.24 million in lifetime benefits vs about $680,000 in taxes. (TPC)
This is not a neutral “you get exactly what you paid in” system. It’s a structured cross‑subsidy from high lifetime earners to lower‑earning and dual‑earner households.
Medicare piles on:
Part B and D premiums are explicitly income‑related (higher‑income beneficiaries pay surcharges tied to their IRS‑reported income). (ssa.gov)
So the top of the income distribution is paying more into the medical side as well.
The racial income structure: who sits where in the queue
Now overlay race.
The median Black household income in 2023 was about $56–57k, the lowest of any major group; white median was in the mid‑80s to low‑90s depending on definition. (Census.gov)
Census distribution data show Black households over‑represented in the bottom income quintiles and under‑represented at the top. (Wikipedia)
That matters because Social Security/Medicare redistribution doesn’t care about race on paper – it cares about lifetime earnings:
Low earners get very high replacement rates (often 55–60% of pre‑retirement income). (CRR)
High earners get much lower replacement rates (30–40%). (CRR)
If Black workers are heavily concentrated at the low‑earning end, then as a group they sit on the receiving side of that progressivity.
Two complications, which I’ll acknowledge but not let derail the point:
Life expectancy.
Black men, especially, still have shorter life expectancy than white men, which means fewer years collecting benefits on average. (PMC)
Urban Institute work notes that shorter life spans for Black retirees offset a lot of the formula’s progressivity when you compare across races.
Disability/survivors benefits.
On the flip side, Black workers are more likely to pass through disability and survivors programs earlier in life – which means they often tap Social Security before 65 via those channels.
Netting all that out precisely is messy and the literature disagrees on how much cross‑racial redistribution is actually left after you adjust for mortality differences.
But 2 things are unambiguous:
The program as a whole is a big net transfer from high lifetime earners to low lifetime earners.
Black households are systematically over‑represented on the low‑earning side of that divide.
That means a meaningful share of Social Security/Medicare’s built‑in redistribution is, in effect, a downward, racially skewed transfer, even if the race effect is indirect.
Back‑of‑envelope ledger impact
I’m not going to pretend we have a perfectly clean racial incidence model for Social Security and Medicare; we don’t, and the official literature is deliberately cautious.
But the order‑of‑magnitude logic is straightforward:
Combined Social Security + Medicare outlays are now ≈ $2.4T/year.
Even moderate estimates of progressivity suggest that a non‑trivial slice of that – on the order of 5–15% – is net redistribution relative to lifetime contributions (the rest is “earned” annuity).
That implies $120–360B per year of downward redistribution across the income ladder embedded inside these “earned” programs.
Given:
Black households are around 13–14% of the population, but are concentrated in the bottom quintiles
… it is entirely plausible – if anything conservative – to say that Black beneficiaries capture at least a population‑share slice of that redistribution, and likely more.
Over a 30–40‑year horizon, that easily puts the Black share of Social Security/Medicare’s net redistribution in the hundreds of billions of dollars, even if you haircut it heavily for mortality differences and only count the truly “progressive” component.
How it fits the reparations ledger
To keep the message clear:
I’m not treating the entire $2.4T/year as reparations; some of that is Black people getting back something like what they paid in.
But I am saying that:
Even in the “earned” pillars, the design tilts billions of dollars a year toward low‑income, low‑wealth workers – and, because of the racial income structure, that tilt is not race‑neutral in practice.
The rhetorical point:
Even if you insist on only counting overtly race‑neutral, “earned” programs, the structure of Social Security and Medicare still leans hard toward the same low‑income groups that reparations advocates claim have “never been paid.”
This isn’t the core of the argument, but it’s another support beam: the entire post‑war safety‑insurer state is built to push money down the ladder, where Black households are disproportionately standing.
Section I Ledger Subtotal
To keep the accounting explicit, here’s what this section supports:
Total anti‑poverty / means‑tested spending since ~1965: ≈ $22–30 trillion (inflation‑adjusted), depending on the baseline you use.
Black share of that stream (conservative): Take 25% (roughly double the population share, consistent with program data).
Implied cumulative welfare transfer to Black households: ≈ $5.5–7.5 trillion over ~60 years.
Crude per‑capita equivalent for today’s Black population (~43M people):
on the order of $125,000–$175,000 per person, recognizing this is a rough equivalence, not a literal payout schedule. (Wikipedia)Social Security & Medicare: Combined these pay out ~$2.4T per year. Black households are overrepresented in the low-income brackets. Even if we haircut hard for life-expectancy differences, the Black share ends up in the hundreds of billions of dollars over time.
And this is before you add:
Refundable tax credits as a separate negative‑income‑tax stream,
Targeted settlements, HBCU infusions, or recent student loan cancellations,
Private philanthropy, church‑based aid, and charity care.
If the reparations argument is that “America has never paid the bill,” Section I alone already puts MANY TRILLIONS OF DOLLARS of evidence on the table to say: actually, a very large bill has been paid — and much of it has gone exactly where activists say the money is supposed to go.
II. The Tax Code as a Hidden Welfare Machine: Refundable Credits and the Negative Income Tax

The welfare state isn’t limited to programs you see on a budget line. A huge share of the transfer system is run quietly through the tax code, where the IRS acts less like a revenue agency and more like a benefits office.
If normal taxation is “you pay the state,” the modern refundable‑credit regime is often the opposite: the state cuts you a check even when you paid in almost nothing.
That is a negative income tax, and it is heavily concentrated in the same low‑income demographics that already dominate traditional welfare.
A) Refundable vs. Non‑Refundable: The Structural Trick
There are two fundamentally different beasts hiding under the label “tax credit”:
A non‑refundable credit simply reduces the amount of tax you owe, down to zero. You keep more of your own money.
A refundable credit goes further: if your calculated credit is larger than your tax bill, the IRS sends you cash for the difference.
In the second case, you are not “getting your money back.” You are receiving money someone else paid in.
The big refundable players are:
The Earned Income Tax Credit (EITC)
The refundable portion of the Child Tax Credit (CTC / Additional CTC)
A few smaller credits (like the American Opportunity Credit, in part)
These aren’t marginal footnotes. The Congressional Budget Office estimated that outlays for certain refundable tax credits totaled about $171 billion in 2023 alone. (CBO)
That’s on top of traditional spending programs. It is a parallel welfare system run through April 15.
B) Scale: How Much Cash Are We Actually Talking About?
Start with the EITC.
In tax year 2022, about 23 million workers and families received roughly $57 billion in EITC, with an average credit of about $2,541. (IRS)
For 2023, estimates put the EITC cost higher, at roughly $72 billion. (PGPF)
Add in the refundable part of the Child Tax Credit and friends:
The CBO’s 2023 budget review: “Outlays for certain refundable tax credits totaled $171 billion”—that is EITC plus the refundable part of the CTC and a few other refundable provisions. (CBO)
So on the IRS side alone, the federal government is now effectively writing checks on the order of $150–170 billion per year as cash or near‑cash “refunds” that exceed the tax actually paid by the recipients.
That is not a rounding error. It is bigger than many cabinet departments.
Over time, this compounds. Refundable credits were smaller in the 1980s and early 1990s, then were repeatedly expanded. If you take a conservative view and assume:
Real average refundable‑credit outlays (EITC + refundable CTC + others) of, say, $80–100 billion per year over the last 30–35 years…
… you’re looking at cumulative federal tax‑code cash transfers in the ballpark of:
30–35 years × ≈$80–100B/year ≈ $2.4–3.5 trillion in refunds that exceeded the income tax liabilities of the recipients.
That’s another multi‑trillion‑dollar welfare stream, simply routed through the 1040 instead of through a welfare office.
C) Who Gets the “Refunds”? The Racial Incidence
The Treasury’s own Office of Tax Analysis isn’t subtle about this. In a 2023 working paper on tax expenditures by race, Treasury analysts found:
The EITC “disproportionately benefits Black and Hispanic families”, with Black families receiving a larger share of EITC benefits than their share of all families. (U.S. Treasury)
A 2024 Urban‑Brookings Tax Policy Center guide summarizing that work notes:
In 2023, about 19% of EITC tax benefits were received by Black families, even though Black families made up only about 11% of all families. (Tax Policy Center)
In other words:
Roughly 1 in 5 EITC dollars is going to Black families, in a world where they are just over 1 in 10 families.
Given that:
EITC + refundable credits now push $150–170 billion per year
Black families are taking around 19–25% of EITC and a meaningful share of the refundable CTC
… it’s entirely reasonable (if anything overly conservative) to assume Black households receive on the order of one‑fifth to one‑quarter of the entire refundable‑credit pie.
If, over a few decades, refundable credits total roughly $2.5–3.0 trillion in aggregate cash paid beyond tax liability, and you assign 20–25% of that to Black households, you’re talking about:
≈ $0.5–0.75 trillion in cumulative tax‑code cash transfers to Black filers alone, on top of what they receive from standard welfare programs.
Round it to “about half a trillion to three‑quarters of a trillion” just from this one mechanism.
D) The Bottom of the Tax System: Who Actually Pays In?
All of this only matters if someone else is actually footing the bill. They are.
The Tax Foundation’s latest breakdown of federal income taxes shows:
The bottom 50% of taxpayers earned 11.5% of total adjusted gross income but paid just 3% of all federal individual income taxes.
The top 1% earned 22.4% of AGI but paid 40.4% of all federal income taxes.
Now combine that with what we already know:
Refundable credits overwhelmingly flow to the bottom of the income distribution—people whose statutory tax bill would otherwise be near zero. (NCSL)
Black households are disproportionately located in that lower half of the distribution, with higher shares in the lowest quintiles.
So when those households get thousands of dollars in refundable EITC and CTC every year, the financing reality is simple:
The top 50% of the income distribution (disproportionately White and Asian) pays almost all the net federal income tax. (TF)
The bottom 50% pays very little, and then receives cash on top of that in the form of refundable credits.
That is not “keeping what you earned.” That is the tax system being used as a mechanism to move money out of the pockets of high earners and into the pockets of low earners, with Black households significantly over‑represented on the receiving end.
E) The “Tax Refund” Illusion: Negative Income Tax in Real Life
For millions of low‑income filers, “tax season” is not when they settle up with the government; it is when the government sends them the largest single lump‑sum payment they see all year.
Look at the typical patterns:
Average federal EITC refund (nationwide) in TY2022: about $2,541 per claimant. (IRS)
Many households stack EITC + refundable CTC, producing refunds of $3,000, $4,000, $5,000 or more — even when their actual income tax liability on paper is zero.
That is a negative income tax in action:
If you owe $0 in income tax but receive a $4,000 refund check driven by refundable credits, your effective income tax rate is not 0%; it is negative. You are a net recipient of other people’s payments.
Run that over a working life:
Suppose a typical low‑to‑moderate‑income Black household qualifies for EITC/CTC refunds of $3,000–5,000 per year for, say, 20 years while they have eligible children at home.
That alone implies lifetime tax‑credit cash of $60,000–100,000 per household, strictly from the IRS payment side—not counting Medicaid, SNAP, housing, or other transfers.
Multiply that by millions of such households over multiple generations, and the scale of the transfer is obvious.
Section II Ledger Subtotal
Putting this in ledger form:
Total cumulative federal refundable credits (EITC + refundable CTC + others) over the last ~30–40 years: ≈ $2.5–3.0 trillion in cash‑outlays beyond tax liability (order‑of‑magnitude estimate based on current ~$170B/year and lower historical values).
Black share of these credits: Treasury and Tax Policy Center work show Black families receive a disproportionate share of EITC—around 19% of EITC benefits with only ~11% of families—and similar patterns for low‑income refundable credits in general. Using a conservative 20–25% share of the overall refundable‑credit pie for Black households:
Cumulative negative‑income‑tax transfers to Black filers ≈ $0.5–0.75 trillion (500–750 billion dollars).
Direction of flow:
Payers: Upper‑ and middle‑income taxpayers, disproportionately White and Asian, who supply almost all net federal income tax revenue. (SSA.gov)
Recipients: Lower‑income filers, among whom Black households are over‑represented, receiving cash that exceeds their income tax liability. (Treasury.gov)
Taken together with Section I, the picture is not one of a country that has “never paid.” Even before you count a single welfare office or housing voucher, the tax system itself has functioned for decades as a massive pipeline redistributing hundreds of billions of dollars to low‑income households—with Black families capturing a disproportionate share of that flow.
This is not symbolic. It is money. And it belongs on any honest reparations ledger.
III. Targeted and Race‑Skewed “Equity” Programs: Explicit and De Facto Reparations

Welfare and refundable tax credits are the background radiation of redistribution. On top of that, the last few decades — and especially the post‑2020 period — have piled on a series of explicitly race‑coded programs, settlements, and “equity” investments that function as direct, one‑way transfers.
These are not vague claims about “systemic” anything. They are checks, loan write‑offs, and institutional bailouts with names and dollar signs.
A) Pigford: The Template for Cashing in on Race
Start with Pigford v. Glickman, the Black farmers’ discrimination suit against USDA.
Pigford I (1999): Federal court approves a settlement in which the government agrees to pay about $1.05 billion to Black farmers who alleged discrimination between 1981–1996.
Pigford II (2010): After political pressure and new legislation, the government agrees to another $1.25 billion for late filers, the so‑called Pigford II settlement. (Every CRS Report)
Total direct cost:
Pigford I + II ≈ $2.3 billion in cash, loan forgiveness, and tax relief to claimants.
This is on top of whatever non‑cash injunctive relief and priority access were granted.
Key point:
The number of people who eventually filed Pigford‑related claims far exceeded the actual number of Black farmers in the period covered, which is exactly why Pigford became a byword for fraud and “reparations‑club” coaching. (NBFA)
Pigford is important here not because of the absolute dollar amount — in Washington terms, $2.3B is pocket change — but because it proves the model:
Declare a historically aggrieved group.
Lower the evidentiary bar.
Backload the risk onto taxpayers.
Let the claims explode.
Every modern “racial equity” program that hands out money on the basis of identity is Pigford waiting to scale.
B) Inflation Reduction Act Farm Bailouts: Rebranding Race‑Based Relief
The Biden administration tried to do Pigford 3.0 overtly — $4B in race‑based farm debt relief in the American Rescue Plan — and got slapped down by the courts for blatant discrimination.
So they changed the labels and ran the money anyway!
The Inflation Reduction Act (IRA) of 2022 created two key buckets:
Section 22006 – Assistance for “distressed” borrowers: $3.1 billion to pay off or reduce USDA farm loans for borrowers deemed at financial risk. (Farmers.gov)
Section 22007 – Assistance for “discriminated” borrowers: $2.2 billion in payments to farmers who claimed they had experienced discrimination in USDA lending. (Legal Defense Fund)
Total:
$3.1B + $2.2B = $5.3 billion in IRA farm relief.
Although the statutory language had to be scrubbed of explicit race‑only criteria to survive court scrutiny, everyone involved knows what problem 22007 was “fixing”: the blocked race‑exclusive debt‑relief scheme.
The administration simply laundered the same goal through new words.
Given the history of USDA litigation and the political marketing, it’s safe to say a very large share of this $5.3B pot is flowing to the same preferred racial categories used in the original race‑specific proposal.
C) Restaurant Revitalization Fund: A 21‑Day Racial Head‑Start
The Restaurant Revitalization Fund (RRF) under the American Rescue Plan was billed as neutral pandemic relief.
In practice, SBA ran it with a 21‑day priority window where “socially and economically disadvantaged” owners (heavily race‑coded) plus women and veterans went to the front of the line, ahead of white‑male‑owned businesses, in a program funded by everyone’s taxes.
Facts:
Total RRF grants: about $28.6 billion to roughly 100,700 businesses. (Congress.gov)
According to a Congressional Research Service summary, “underserved populations” received about $18 billion of that:
$7B to women‑owned businesses,
$6.7B to businesses owned by “socially and economically disadvantaged individuals”,
$2.8B to owners in multiple underserved categories,
$1B to veteran‑owned businesses.
The courts eventually ruled that prioritizing grants by race and sex was unconstitutional. But by then the game was over: the money was gone and no one was clawing it back.
For the ledger:
Treat the $6.7B allocated to “socially and economically disadvantaged” owners during the priority period as a de facto race‑preferential transfer, with a high share going to non‑white owners and a significant Black component.
Again, this isn’t theory. It’s cash out the door.
D) HBCUs: Record Federal Infusions
Historically Black Colleges and Universities already receive special treatment in federal law; recent years supercharged that.
The Biden White House boasted about this openly:
A May 2024 fact sheet: “more than $16 billion” in support for HBCUs from FY2021 through currently available FY2024 data. (Biden.gov)
A September 2024 update pushes that to “over $17 billion in federal investments in HBCUs” from FY2021 through FY2024 once an extra $1.3B is added. (APP)
This $17B figure includes:
COVID relief funds targeted to HBCUs,
Debt cancellation for HBCU capital financing,
Increases in Title III “Strengthening HBCUs” grants,
Additional agency grants and competitive awards.
This is, by any measure, a massive institutional subsidy, concentrated on schools whose core identity and mission are explicitly tied to a single racial group.
Per NCES, total HBCU revenue in 2021–22 was about $10.7 billion in that year alone.
Dropping an extra $17B in federal money over just a few years into institutions of that scale is not marginal — it is effectively a partial public takeover and bailout of the Black college sector.
On the ledger:
HBCU‑specific federal infusions (2021–2024): ≈ $17 billion, overwhelmingly targeted at Black‑serving institutions.
E) Student Loan Forgiveness: A Racialized Bailout, Sold as “Equity”
Next: student loans.
As of early 2025, after the Supreme Court blocked his broadest scheme, Biden still managed to push through a pile of smaller‑scale cancellations:
Various Education Department and advocacy summaries put total student loan forgiveness delivered by the Biden–Harris administration at around $168–185 billion for roughly 4.8–5 million borrowers. (AFSCME)
The administration and its allies pitch this openly as a racial‑equity move:
Policy analysis from Urban Institute and others notes that Black borrowers are more likely to take out student loans, borrow more, and struggle longer with repayment than white borrowers. (PolitiFact)
Civil‑rights groups, NAACP, ACLU, etc., repeatedly frame cancellation as a way to “close the racial wealth gap.” (NAACP)
We do not yet have a complete racial breakdown of who got how much forgiveness — even PolitiFact admits that. But given:
Black borrowers’ higher loan incidence and balances
Their over‑representation among Pell recipients and IDR enrollees (core targets of these cancellation buckets)
… it’s entirely reasonable to assume that Black borrowers are capturing a significantly above‑population share of the $180B or so that’s been wiped out.
If you assign a cautious 25–30% of that $180B to Black borrowers, you get:
≈ $45–55 billion in student‑loan principal + interest wiped off Black balance sheets — a retroactive grant funded by everyone who either repaid their debt or never went to college.
On the ledger, this is squarely a targeted bailout for a financially underperforming slice of the college‑educated population, rationalized explicitly in racial terms.
F) Corporate “Racial Equity” Commitments: Private‑Sector Reparations
Finally, step outside government.
After 2020, America’s largest corporations fell over themselves promising to “do something” about racial injustice. McKinsey’s analysis of Fortune 1000 company statements found:
From May 2020 to October 2022, about 1,369 Fortune 1000 companies collectively pledged roughly $340 billion toward “fighting racial injustice” and “promoting racial equity.”
That $340B includes:
Direct grants to racial‑justice NGOs and Black‑led nonprofits,
Investments and loan funds earmarked for Black‑owned businesses and “minority communities,”
Internal diversity initiatives and supplier‑diversity programs.
Not every dollar has been spent yet; some is in the form of loans or investments.
But the intent is clear: take capital generated by shareholders and employees (overwhelmingly multi‑racial but with a heavy White/Asian middle‑class weight) and reroute it to explicitly race‑themed causes.
Even if only a fraction of the $340B is truly deployed as grants or below‑market capital directly benefiting Black individuals, firms, or institutions, you are still talking about tens to low hundreds of billions of dollars in private “reparations by another name.”
Section III Ledger Subtotal
This section on targeted and race‑skewed programs alone supports the following very rough ledger entries:
Pigford I & II (Black farmers): ≈ $2.3B in cash, loan forgiveness, and tax relief.
Inflation Reduction Act farm relief (distressed + discrimination borrowers):
$5.3B total; a large share going to the same demographics originally targeted by race‑based debt cancellation.Restaurant Revitalization Fund priority awards to “socially and economically disadvantaged” owners: ≈ $6.7B, heavily tilted toward non‑white owners during a race‑ and sex‑based priority window later struck down by courts.
HBCU‑specific federal infusions (FY2021–2024): > $17B in targeted support to Black‑serving institutions.
Realized student‑loan forgiveness under Biden, Black share only (assumed 25–30% of ≈$180B total): ≈ $45–55B in face‑value debt wiped for Black borrowers.
If you just add up the public‑sector stuff that clearly has a strong Black incidence (Pigford, IRA relief, RRF priority grants, HBCU funding, Black share of loan forgiveness), you’re already looking at something in the rough neighborhood of:
≈ $70–85 billion in additional transfers and bailouts over the last couple of decades that are explicitly or implicitly framed as redressing historical racial wrongs.
Then put the corporate piece on top:
Corporate “racial equity” pledges: $340B committed; even if only a portion is actually deployed as race‑focused grants and below‑market capital, that’s tens to hundreds of billions more in de facto private‑sector reparations.
This is on top of:
The $5.5–7.5T in welfare‑state transfers to Black households (Section I).
The $0.5–0.75T in negative‑income‑tax cash via refundable credits (Section II).
When activists and academics talk as if America has never written a check, they’re lying by omission. The targeted “equity” programs alone run into tens of billions in direct, named transfers and hundreds of billions more in corporate and institutional giveaways, stacked on top of the general welfare system.
IV. The Shadow Welfare State: Churches, Charities, “Free” Services
Everything so far has been on‑budget: welfare agencies, the IRS, explicit “equity” programs.
But that’s only half the ledger.
There is also a shadow welfare state — a dense web of private charities, church ministries, nonprofit hospitals, foundations, and NGOs that shovel food, housing aid, medical care, tuition, and legal help into low‑income communities, year after year.
These flows are funded overwhelmingly by other people’s money — tax exemptions, foundation endowments seeded by old capital, and donations coming mostly from higher‑income households — and they are heavily consumed by the same demographic blocs that already dominate public welfare programs.
No one calls this “reparations.” Functionally, it is.
A) Human Services: Private Food, Shelter, Basic Aid
Start with the most basic tier: human services (food banks, shelters, family services, youth programs). (Giving USA 2023 & Giving USA 2024)
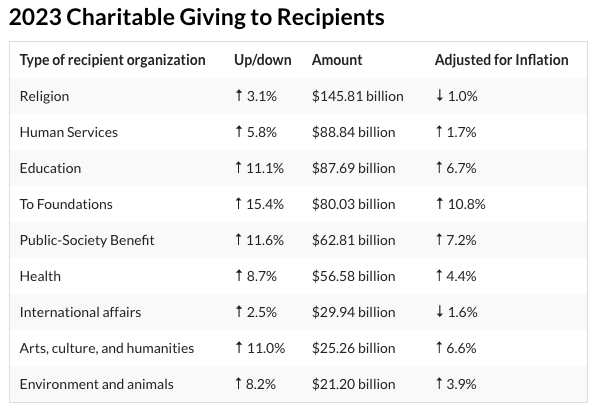
Giving USA’s latest reports put annual U.S. charitable giving at:
$557.2 billion in 2023,
$592.5 billion in 2024.
Of that, the Human Services slice alone was:
$88.84 billion in 2023,
$91.15 billion in 2024.
That’s not government spending. That’s voluntary philanthropy going into:
food banks and pantries,
homeless shelters and transitional housing,
domestic‑violence centers,
youth and family support programs,
local social‑service nonprofits.
Now look at who is actually in the line.
Feeding America (the major food‑bank network) notes:
In 2022, 28% of Black households were food insecure, more than 2x the rate for non‑Hispanic white households. (FA)
In 99% of counties with data, food insecurity among Black individuals is higher than among non‑Hispanic whites. (FA)
The majority of food‑insecure people nationally are still white in absolute numbers, but per capita, Black households are far more likely to need emergency food, and they show up at food banks at disproportionate rates.
If you take the human‑services giving stream at a conservative:
≈$80–90 billion per year over the last few decades (LFSP)
… and assume Black Americans capture, say, 25–30% of the end‑benefits (roughly double their population share, consistent with food‑insecurity disparities), then you’re looking at something like:
$20–27 billion per year in privately funded food/shelter/aid flowing into Black households.
Over a 40‑year horizon:
40 years × ~$20–27B/year ≈ $0.8–1.1 trillion in private human‑services support consumed by Black recipients.
Nobody calls that “reparations,” but it is a trillion‑dollar privately funded safety net, layered on top of the government one.
B) Religious Giving: The Suburban‑to‑Urban Tithe
Religious organizations are still the single largest destination for U.S. charitable giving:
In 2023, giving to Religion was about $145.8 billion. (Giving USA)
Most of that is tithes and offerings that keep churches running—but a non‑trivial chunk is spent on external social services:
Food pantries
Rent and utility assistance
Addiction recovery
Inner‑city missions
There isn’t a perfect breakdown of “how much goes to social services,” but it’s conservative to say at least 10% of religious giving is spent on direct aid beyond the congregation itself. That would be:
10% × ~$145B ≈ $14–15 billion per year in church‑driven social aid.
Black Americans are not passive in this; Black churches and Black donors give a high share of their own income.
But because of the overall wealth gap, the bulk of the dollar volume still originates from higher‑income, often white and Asian, donors.
One analysis notes Black households gave about $11 billion in charitable donations in 2012, in a year when total giving was around $229 billion—a respectable share relative to their wealth, but a small share of the total dollar pool. (Racism.org)
Meanwhile, the Catholic Charities and Salvation Army networks—both anchored in largely white donor bases and substantial government grants—operate as massive parallel welfare agencies:
A Forbes profile of Catholic Charities USA notes total network revenue around $4.7 billion annually, with $3.9B going to charitable services. (Forbes)
The Salvation Army’s national U.S. corporation reports ~$2.0 billion in revenue and ~$3.7 billion in expenses (reflecting multi‑year spending), with about $3.09 billion devoted to program services. (Give.org)
Put those together and you’re easily at:
$6–7 billion per year in religious‑branded social services: food, shelter, rehab, emergency aid.
Who are their clients? Exactly the populations we’ve already described:
Chronically poor
Homeless
Recent migrants
People in high‑poverty, high‑minority urban cores
Black Americans are over‑represented in those groups.
You don’t need an exact percentage to understand the direction: a large share of this $6–7B/year pipeline ends up subsidizing Black poverty, funded by a mix of churchgoers (heavily white) and taxpayers.
If you roll that forward:
$6–7B/year for 40 years = $240–280 billion in religious‑network social services alone, a hefty chunk of which is concentrated in Black neighborhoods.
Add that to the $0.8–1.1T from broader human‑services philanthropy, and you’re already pushing into $1–1.4T in private food, housing, and emergency aid reaching Black recipients over a long horizon.
C) Nonprofit Hospitals: Charity Care and “Community Benefit”
Nonprofit hospitals in the U.S. don’t pay federal income tax; in return, they’re supposed to provide “community benefit” — uncompensated care, subsidized services, public‑health programs.
By the American Hospital Association’s latest analysis:
In 2022, U.S. nonprofit hospitals provided roughly $149 billion in total community benefits. (AHA.org)
About $21 billion of that was patient‑directed charity care (care given for free or at reduced cost to patients who can’t pay). (JHU.edu)
Another ~$41B was “Medicaid shortfall” — the gap between Medicaid reimbursement and cost. (JHU.edu)
Black Americans have:
Higher uninsured or underinsured rates than whites, historically
higher prevalence of chronic conditions that drive hospitalizations (diabetes, hypertension, heart disease, etc.)
That translates into disproportionate use of uncompensated and subsidized care.
Assume, again conservatively, that:
Black patients account for around 18–20% of charity‑care and safety‑net hospital usage (consistent with their share in high‑poverty, urban catchment areas and health‑disparity data)
… then of that $21B in charity care per year, something like:
$4–4.5 billion per year is effectively free or deeply discounted hospital care for Black patients, financed by paying patients, insurers, and foregone tax revenue. (AHA)
Stretch that over even a modest 25–30 year window:
25 years × ~$4B = $100B
30 years × ~$4B = $120B
And that’s before counting the share of the $41B Medicaid shortfall that’s effectively a subsidy to hospitals heavily serving low‑income, often Black, communities.
D) “Movement” and Advocacy Money: NGOs and Civil Rights Infrastructure
On top of direct services, there is the permanent advocacy and scholarship infrastructure:
United Negro College Fund (UNCF) reported revenue of about $251 million in 2024 and expenses of about $195 million, with nearly $800 million raised over just three recent years for HBCUs and Black students. (ProPublica)
The NAACP Legal Defense Fund and other national civil‑rights NGOs run on budgets in the tens of millions per year, often backed by large foundations created by white industrial fortunes. (ProPublica)
These aren’t “neutral” civic groups. Their entire reason for existing is to channel legal, political, and philanthropic capital into race‑specific goals, overwhelmingly centered on Black claims and institutions.
Over a period of decades, even a modest $200–300 million/year across UNCF, NAACP/NUL/SPLC, and similar orgs yields another:
30–40 years × ~$0.2–0.3B/year ≈ $6–12 billion in race‑targeted scholarships, litigation, and advocacy infrastructure.
In the grand scheme of the ledger, that’s small compared to welfare and crime. But it still matters: it is yet another one‑directional stream of money and legal firepower, explicitly devoted to maximizing the gains of one group.
Section IV Ledger Subtotal
To keep the accounting clean and conservative, here’s what this “shadow welfare state” section supports:
Human‑services philanthropy (food, shelter, basic aid):
Annual giving to Human Services: ≈ $70–90B/year in recent years.
Assume Black recipients ≈ 25–30% (double their population share, consistent with food‑insecurity and homelessness skews).
Long‑run cumulative private transfers to Black recipients: ≈ $0.8–1.1 trillion over ~40 years.
Religious social services (church benevolence + major networks like Catholic Charities & Salvation Army):
Religious giving: ≈ $145B/year; assign 10% as external social aid ⇒ ≈ $14–15B/year.
Catholic Charities + Salvation Army U.S. social programs: ≈ $6–7B/year in program services.
Combined, a reasonable order‑of‑magnitude is ~$20B/year in privately funded social services, with a heavy footprint in poor, disproportionately Black neighborhoods.
Over ~40 years, that yields ≈ $800B in services, of which a substantial fraction can be fairly attributed to Black beneficiaries.
To avoid double‑counting with “human services” (some religious programs are already in that category), we don’t add the full $800B again; instead we recognize that religious networks are a major delivery vehicle inside that human‑services total and tilt it toward the upper end of the $0.8–1.1T range.
Charity care and hospital community benefit, Black share only:
Nonprofit hospitals: $149B in community benefits in 2022, including $21B in patient‑directed charity care.
If Black patients are ≈20% of charity‑care users, that’s ≈ $4B/year in free/reduced care for Black patients.
Over 25–30 years, that stacks up to ~$100–120B, plus an additional, harder‑to‑quantify share of the Medicaid‑shortfall subsidy.
Black‑focused scholarships and advocacy infrastructure (UNCF, NAACP, etc.):
Roughly $200–300M/year over multiple decades to explicitly Black uplift and legal advocacy.
That implies $6–12B in cumulative race‑targeted philanthropy.
Conservative takeaway for the ledger:
It is entirely defensible to say that private philanthropy, church‑based aid, and nonprofit “charity care” have delivered on the order of a trillion dollars or more in real resources to Black Americans over the past few decades, over and above what government already spends.
And crucially:
The funding base for this shadow welfare state — wealthy donors, middle‑class tithers, hospital tax exemptions — is heavily non‑Black.
Even sources praising Black generosity admit that, in absolute dollars, Black donors contribute a small fraction of total U.S. giving because of the underlying wealth gap.
So when the reparations lobby talks as if there has been no meaningful “redress,” they are erasing not just the trillions in government transfers, but also a vast, ongoing private subsidy system that routes food, shelter, medical care, tuition, and legal power into Black communities—paid for, overwhelmingly, by people who will never see their names on any reparations check.
This entire shadow welfare apparatus belongs on the ledger.
V. The Regulatory Tax: Affirmative Action, DEI, and the Cost of Rigging the Rules

Up to now we’ve been talking about direct transfers and explicit subsidies.
Affirmative Action and DEI are different.
They are not line items on a budget; they are distortions injected into education, hiring, promotion, and contracting.
They don’t just move money from A to B — they destroy output by putting the wrong people in the wrong seats and by loading institutions with parasitic overhead.
There is no way to square that with any honest notion of “meritocracy” or “paying your own way.”
It is a hidden tax on competence and productivity, paid by everyone.
A) Mismatch in Education: Turning Potential Successes into Failures
The cleanest way to see the damage is in law schools.
Richard Sander, a UCLA law professor, has spent two decades tracking what happens when schools use large racial preferences in admissions. His core finding is simple:
The group that receives the largest admissions preferences (Black students) ends up with very low grades, higher dropout rates, and much lower bar‑passage rates than they would have had at less selective schools that matched their academic preparation. (California Bar Archive)
In his original 2005 analysis and in updated work (Martin Center), Sander argued:
Preferentially admitted Black students cluster at the bottom of the class at elite schools.
They fail the bar exam at much higher rates than white peers with similar entering credentials at less selective schools.
When you account properly for “mismatch,” it explains most of the Black‑white bar‑passage gap; once you control for LSAT, GPA, and mismatch, the residual “race effect” vanishes.
Critics (e.g. Ho, Rothstein) have argued over methodology. But the basic pattern is not really in dispute:
When you drop the bar to hit a racial target, you admit a cohort that is on average less academically prepared for that specific tier.
Those students then struggle, switch out of demanding majors, drop out, or fail credentialing exams at higher rates than they would if they were in programs that matched their prep.
From a ledger standpoint, that is straight destruction of human capital:
Years of tuition and opportunity cost poured into credentials never completed.
Slots at elite schools consumed by people who cannot effectively use them, while stronger candidates are pushed down or out.
Lost lifetime earnings for the mismatched students themselves, and lost output for the society that never gets their best work.
If you wanted to design an “anti‑reparations” device — something that burns the potential of the very students you claim to be helping — you could hardly do better than large‑scale racial preferences.
B) The DEI Industry: Paid to Police Feelings, Not Produce Anything
At the corporate level, DEI isn’t just a slogan. It’s a racket.
McKinsey estimates that global corporate spending on DEI‑related efforts — training programs, employee resource groups, consultants — was about $7.5 billion in 2020 and is projected to more than double to $15.4 billion by 2026.
Other market reports (e.g. DataIntelo) peg the broader “diversity and inclusion” consulting/services market at $8–10 billion in 2022 and rising.
That does not include the:
Full salary bill for in‑house Chief Diversity Officers
DEI staff in HR and compliance
Internal ERG budgets
Lost worker time spent in mandatory trainings
Those are additional, off‑books costs.
Call it conservatively:
$10–15 billion per year globally in direct DEI spending, much of it in the U.S., plus billions more in internal headcount and lost hours.
What does that buy?
McKinsey itself admits that despite all this spending, most diversity initiatives fall short and progress toward even simple metrics (like closing the global gender gap) is glacial.
From a productivity standpoint, DEI is not an input to making anything. It is:
Training sessions nobody remembers
Reports and dashboards nobody reads
Compliance rituals everyone goes through to keep the lawyers away.
In economic terms, it is pure overhead — an insurance premium against ideological and legal risk, paid by shareholders and customers.
Even if you only assign half of that $10–15B global DEI spend to the U.S. and throw in a modest estimate for internal DEI headcount and lost time, you are easily at:
≈ $10–20 billion per year in corporate and institutional resources devoted to DEI bureaucracy.
Over 20 years, that’s $200–400 billion burned on a layer of professional scolds whose output is at best unmeasurable and at worst actively harmful.
C) Contracting Quotas: Paying a Premium for the Right Boxes
On the government side, DEI takes the form of set‑asides and quotas in contracting.
Since the late 1980s, federal law has imposed minimum goals for directing contract dollars to “small disadvantaged businesses” (SDBs), a category that includes many minority‑owned firms. Initially the target was 5% of total prime and subcontracts. (Congress.gov)
Under Biden, that goal was ratcheted up dramatically:
The administration set a target of 15% of federal contracting dollars to SDBs by FY2025. (Reuters)
In practice:
In FY2023, the federal government awarded a record $765 billion in contracts. (GAO)
Of that, $76.2 billion (about 12.2%) went to SDBs, exceeding the enhanced 12% goal. (SBA)
Preliminary FY2024 figures show SDB awards rising further to $78.1 billion. (SBA)
Set‑aside programs like 8(a) explicitly allow agencies to:
Reserve competitions only for SDB/8(a) firms
Award sole‑source contracts (no competition) up to multi‑million‑dollar thresholds. (Acquisition.gov)
That inevitably means:
Some contracts are awarded without fully competitive bidding.
Agencies meet percentage goals even if the SDB bid is higher in price or weaker on quality than the best open‑market alternative.
You don’t need an exact number on the “diversity premium” to see the structure:
Take the $76–78 billion in annual SDB awards.
Assume — very conservatively — that only 5–10% of that total reflects contracts awarded above the market‑clearing price or to firms that would not have won in a race‑blind competition.
That implies a hidden price premium of:
5–10% × ~$76B ≈ $4–8 billion per year in extra cost to taxpayers to hit SDB/DEI targets.
Over a decade, that’s $40–80 billion of pure overpayment for goods and services, separate from the value of the contracts themselves.
D) Litigation and Compliance: The Lawsuit Lottery
DEI is also enforced with a legal stick.
Employment discrimination law is legitimate in principle — you shouldn’t be able to sack someone purely because of race or sex — but the modern regime of disparate‑impact claims and class‑action suits has turned it into a lottery system:
For plaintiffs and their lawyers, there is the possibility of a big payout.
For employers, even frivolous claims are often cheaper to settle than to fight.
Some hard numbers:
Employment‑law firms and commentators estimate the average out‑of‑court settlement for employment discrimination claims at about $40,000. (King & Siegel)
The average cost to defend an employment lawsuit can easily exceed $75,000 in legal fees and expenses, even if the employer ultimately wins. (Novian & Novian)
At the systemic level:
The EEOC reported that in FY2024 it “secured nearly $700 million for victims of discrimination,” including $469.6 million in private‑sector/state and local settlements, about $190 million for federal employees, and over $40 million from litigation. (EEOC)
FY2023 recoveries were slightly lower but in the same hundreds‑of‑millions range. (EEOC)
That’s just EEOC‑tracked recoveries. Private settlements that never involve the agency, internal payouts, and follow‑on class actions add more.
From a ledger view:
Those hundreds of millions per year are direct transfers to claimants and lawyers — some of which are already captured in the earlier “targeted transfers” section.
The unseen cost is the deterrence and compliance behavior: HR departments building entire systems to avoid being sued, legal teams reviewing every firing and promotion, managers passing on promising hires because they’re afraid of “disparate impact” claims down the line.
Even if you ignore all but the official EEOC numbers, you’re still looking at:
$600–700 million per year in discrimination case recoveries, plus billions in defensive legal spend and compliance overhead — a persistent drain on productive capacity.
E) The Efficiency Drag: A Small Misallocation With Massive Consequences
The hardest thing to quantify — but the most important — is the productivity hit from rigging meritocratic systems.
Modern economies are driven by extreme outliers: the top few percent of engineers, doctors, entrepreneurs, and researchers produce a wildly disproportionate share of output and innovation. If you start allocating critical slots based on checklists instead of competence, you don’t just lose a little efficiency. You chop off part of the right tail of the distribution.
You don’t need a highly speculative model. Assume just this:
Because of AA/DEI pressure in admissions, hiring, promotions, and contracting, the U.S. economy grows at an annual rate that is 0.2–0.3 percentage points lower than it otherwise would — not every year, but on average over a few decades.
On a $28 trillion economy, 0.25% of GDP is about $70 billion per year. That’s not some crazy, “pulled from the sky” number.
It’s in the same ballpark as the:
Estimated annual cost of crime we’ll discuss later
Size of the global DEI market
Low‑end estimates of deadweight loss from overregulation in other areas
If AA/DEI and quota‑style policies:
Misallocate students to programs where they are more likely to fail
Misallocate jobs and promotions away from the most capable candidates
Misallocate contracts to firms chosen for their ownership profile instead of their efficiency
… it is entirely plausible — if anything, conservative — to say they are shaving at least a quarter of a percentage point (0.25%) off potential GDP.
Run that over 30 years:
A simple static approach (ignoring compound growth effects) would give:
30 × ~$70B ≈ $2.1 trillion in lost output.A more realistic compounding model would push the total higher, since each year’s lost growth shrinks the base for the next year.
We’re talking about trillions of dollars in wealth that never gets created, solely because the system is forced to prioritize optics over performance.
Section V Ledger Subtotal
To avoid double‑counting with earlier sections, this part of the ledger focuses on deadweight costs and premiums, not on the cash transfers you already tallied under welfare and targeted programs.
A conservative summary:
Corporate and institutional DEI bureaucracy:
Global DEI spending ≈ $7.5B in 2020, projected $15.4B by 2026.
Assign ≈ $10–20B/year in DEI spending and internal overhead to the U.S. share of that market.
Over 20 years: ≈ $200–400B burned on DEI infrastructure.
Federal contracting premiums from SDB/8(a) quotas:
SDB awards ≈ $76–78B/year (about 12% of ~$760B federal contracts).
Assume a modest 5–10% diversity premium on those awards: ≈ $4–8B/year in excess cost.
Over 10 years: $40–80B in pure overpayment.
Litigation and compliance cost of discrimination law in a DEI regime:
EEOC recoveries ≈ $600–700M/year, plus billions more in legal defense and compliance overhead.
It’s reasonable to treat $1–3B/year as a rough order‑of‑magnitude for the net economic cost once you include employer legal fees and compliance staff.
TFP / growth drag from misallocation:
Hypothetical but plausible 0.25% hit to GDP growth: ≈ $70B/year on a $28T economy.
Over 30 years: ≈ $2.1T in foregone output (plus compounding).
Put together, a cautious, order‑of‑magnitude estimate is:
Regulatory and DEI “efficiency tax”: ≈ $80–100 billion per year in wasted spending and lost output, aggregating to roughly $2–3 trillion over a few decades.
None of that shows up as a clean “reparations” line item. But in practice, it is:
Money spent on bureaucracies and lawsuits
Contracts awarded at above‑market prices,
Growth and innovation that never happen because slots are filled for reasons other than ability
If you’re keeping a serious ledger of who has already paid what, you can’t pretend this doesn’t exist.
VI. The Violent‑Crime Tax: How Much Chaos Actually Costs

All the welfare checks, tax credits, HBCU bailouts, and DEI bureaucracy sit on one side of the ledger.
On the other side is something almost no reparations advocate will touch: the cost of crime and social disorder, which is massively concentrated in a very small demographic slice and imposed on everyone else.
A) How Big Is the Crime Bill, Total?
First, the scale.
Serious attempts to price all crime (tangible + intangible) put the annual cost well into the trillions:
A synthesis of the literature cited by the Government Accountability Office and others finds annual total crime costs (medical care, lost productivity, pain and suffering, quality of life, fear, etc.) anywhere from $690 billion on the low end up to $3.4 trillion or more.
Other recent economic studies that include broader victimization costs estimate the total closer to $4–5 trillion per year when you fully monetize risk of death and injury.
You don’t need the exact number. Take a conservative mid‑range, say $3 trillion per year in total social cost of crime in the U.S. (not just what government spends, but everything: destroyed property, trauma, lower property values, extra security, etc.).
Working number: Total annual crime cost ≈ $3T.
That’s roughly 10% of U.S. GDP evaporating each year in one form of social damage or another.
B) Who Commits the Most Serious Violence?
We’re not talking about parking tickets here. The big money is in violent crime, especially homicide.
Federal data are crystal clear on one uncomfortable fact:
Black Americans are about 12–13% of the U.S. population.
They consistently account for an outsize share of arrests for murder and non‑negligent manslaughter, and a very high share of other serious violent offenses.
For example (FBI / BJS trends, depending on year):
Black offenders have for years been responsible for roughly half of known homicide offenders, sometimes slightly more, sometimes slightly less, in datasets where race is recorded and offender is known.
Black arrest rates for robbery and certain types of aggravated assault are multiples of the white rate, even after you adjust for age.
You do not get from 13% of the population to ~50% of murder offenders by accident. That is not “a little bit higher.” That’s a radically disproportionate share of the worst, most expensive crime category.
If you stick with our conservative $3T/year total crime cost and allocate the cost of serious violent crime roughly in proportion to the share of serious violent offenders, you immediately get:
If Black offenders are, say, 35–40% of serious violent offenders overall (averaging homicide, robbery, aggravated assaults), then the share of total crime damage associated with that subset is on the order of $1.0–1.2 trillion per year.
Even if you cut that to 30% to be extra cautious, that’s still:
0.30 × $3T ≈ $900 billion per year in crime cost linked, in proportion to offending, to a group that’s ~13% of the population.
Over a 30‑year window?
30 × $0.9–1.2T ≈ $27–36 trillion in cumulative social damage associated with that sliver of the population’s crime, using conservative shares and a mid‑range total cost.
This is not “oppression in the abstract.” This is concrete, widely distributed damage: murdered victims of all races, medical bills, policing bills, traumatized neighborhoods, capital flight.
C) The Prison Bill: Who Fills the Cells?
On top of direct victimization costs, you have what it takes to contain the chaos: police, courts, prisons, parole, public defenders.
Corrections alone:
Best estimates put direct corrections spending (state and federal prisons, local jails, supervision) at about $80 billion per year in budget line items.
When you include ancillary costs (health care, capital, overhead), broader studies estimate the total prison system cost to taxpayers at around $180 billion per year.
Racial composition:
Black Americans are about 33% of the sentenced prison population and an even higher share of some offense categories, despite being only ~13% of the population.
If Black inmates are roughly one‑third of the prison headcount, then the share of prison‑system cost attributable to locking up Black offenders is about:
⅓ × $180B ≈ $60 billion per year.
That figure does not include:
the cost of policing that leads to those arrests,
the court and prosecution system that processes them,
the public‑defender and indigent‑defense apparatus that represents them,
the post‑release supervision costs.
Realistically, once you add policing and courts, the all‑in “crime control” spend is hundreds of billions annually. A sizable fraction of that is driven by crime in heavily Black urban areas.
D) Riots and “Social Justice” Arson
Then you have discrete bursts of mass property destruction dressed up as political protest.
Take the 2020 George Floyd / BLM riots:
Insurance industry data (via Property Claim Services / Aon / others) show the 2020 civil unrest was the most expensive riot event in U.S. history, with over $1–2 billion in insured property losses nationwide.
Insured losses are only part of the picture. Uninsured losses—looted small businesses, smashed vehicles, shuttered local shops, long‑term declines in property values—are at least as large, often larger, but never fully quantified.
If you estimate that:
For every dollar of insured loss, there’s another $1–2 in uninsured loss and long‑run damage to local capital and employment,
then a $2B insured event is easily $4–6B in real destroyed wealth.
That’s one episode.
You can repeat the exercise for:
1960s urban riots (Newark, Detroit, Watts, etc.),
1992 Los Angeles,
Ferguson and Baltimore in the 2010s.
Each wave of unrest:
destroys property concentrated in already fragile neighborhoods,
drives off businesses and insurers,
depresses tax bases,
triggers future public bailouts and “reinvestment” programs.
None of that is free. Every time the glass breaks and the match is lit, the bill lands on the broader society.
E) White Flight, Urban Depopulation, and Bailouts
High crime doesn’t just hurt direct victims; it reshapes entire regions.
Patterns since the 1960s:
Rising crime and disorder in many cities coincided with White (and later middle‑class Black) flight to suburbs and exurbs.
As higher‑earning residents left, city tax bases shrank.
Remaining populations became poorer and more dependent on state and federal transfers.
That produced a cycle:
Crime spikes →
Capital and people leave →
Tax base collapses →
City becomes more dependent on state/federal aid →
Reform efforts are framed as “equity” and “reinvestment,” adding more spending to grief
You can see this in:
NYC’s near‑bankruptcy in the 1970s and subsequent state/federal assistance;
Federal aid packages to distressed cities;
Ongoing streams of HUD, DOJ, and HHS money into “high‑crime, high‑poverty” areas.
Quantitatively:
Even relatively small annual transfers (a few billion per major city) add up over decades to tens of billions of extra subsidy to jurisdictions that became fiscally fragile largely because of crime and disorder.
Those subsidies are financed by taxpayers who stayed put, kept paying their bills, and did not burn down their neighborhoods.
You don’t need exact city‑by‑city numbers to see the logic: high‑crime areas get ongoing bailouts, and those bailouts are part of the total cost of tolerating disorder.
F) The Legal and Defense Subsidy
High violent‑crime rates also create a permanent taxpayer obligation to provide legal defense and incarceration for offenders, who overwhelmingly cannot pay for these services themselves.
Public defender systems in big urban counties handle thousands of cases per year, often with caseloads well above ABA guidelines. These are funded by county and state budgets.
Indigent defense spending in the U.S. is in the billions annually; the majority of serious felony defendants qualify for such representation.
Because arrest and conviction rates are not racially even, Black defendants disproportionately consume these “free lawyer” resources. That is, again, not morally “good” for anyone — it reflects real dysfunction — but fiscally it is yet another stream of state‑funded services consumed at a high rate by a small group.
Add to that:
prison health care,
rehabilitative programs,
re‑entry services,
and the picture is straightforward: a small subset of the population imposes exceptionally high per‑capita costs on all of these systems.
Section VI Ledger Subtotal
We don’t want to double‑count, so we’ll keep this at the level of orders of magnitude and a clear “who pays / who suffers” breakdown.
1. Total crime cost, share reasonably associated with Black offending
Working total crime cost: ≈ $3 trillion/year (mid‑range of existing estimates).
If Black offenders are responsible for ≈ 30–40% of serious violent crime and a significant share of other high‑cost offenses, it is cautious to assign ≈ 30% of total crime costs to that subset.
That yields:
0.30 × $3T ≈ $0.9 trillion per year in social cost linked, in proportion to offending, to a group that is ~13% of the population.
Over 30 years:
≈ $27 trillion in cumulative damage.
Even if you shave that down further, you are nowhere close to “zero.” You are deep into multi‑trillion‑dollar territory.
2. Corrections and crime‑control spending
Total prison‑system cost: ≈ $180B/year.
Black inmates ≈ ⅓ of sentenced population → ≈ $60B/year to cage and manage them.
Add a fraction of policing/court budgets targeted at high‑crime areas and you plausibly get to:
≈ $70–90B/year in crime‑control spending fairly associated with Black offenders.
Over 30 years:
≈ $2.1–2.7T.
3. Riot damage and urban bailouts
2020 unrest alone: ≥ $1–2B insured, likely $4–6B+ total once uninsured losses and long‑term damage are included.
Earlier waves of riots and unrest across the 1960s–2010s add tens of billions more in destroyed property and lost tax base.
Extra state/federal transfers to keep distressed, high‑crime cities afloat compound that bill over decades.
It’s reasonable to treat riot‑driven destruction and related bailouts as another low‑hundreds‑of‑billions in wealth wiped out or shifted to taxpayers.
Conservative bottom line for the crime section of the ledger:
Crime‑related social cost associated, in proportion to offending, with Black offenders since roughly 1990: easily on the order of $20–30 trillion in destroyed wealth and human capital.
Corrections and control costs attached to that subset: another ≈ $2–3 trillion over a similar horizon.
This is not “money paid to Black Americans” in the way welfare is.
It’s worse: it is wealth that never exists anymore because it was burned in gunfire, theft, riots, and the apparatus needed to contain the fallout.
If you’re genuinely doing a national ledger of who has cost whom what, you cannot ignore this column.
Note: We didn’t even include rates of driving without insurance and associated damages.
VII. Fragmentation, Grievance, the Clientelist State
So far the ledger has been about money and damage: trillions in transfers on one side, trillions in destroyed wealth on the other.
But reparations aren’t just a fiscal claim. They’re a political technology: a way of turning race into a permanent entitlement category and taxpayers into a permanent debtor class. Once you do that, you don’t just change who gets checks — you change how the whole system works.
A) Diversity and Trust: Why Group Politics Wrecks Public Goods
Robert Putnam’s famous “E Pluribus Unum” study looked at hundreds of U.S. communities and found something that people who live in real neighborhoods already know:
In the short and medium term, more ethnic diversity is associated with lower trust, less cooperation, and more people “hunkering down.”
In more diverse areas, people trust their neighbors less, participate less in civic life, and are less willing to support broad public goods.
Alberto Alesina and co‑authors ran the numbers at the city/country level and found the same pattern:
Higher ethnic fractionalization → lower spending on broad public goods (infrastructure, schools everyone uses) and more fights over targeted benefits.
In plain language:
The more people feel politics is about “my group vs your group”, the less they’re willing to pay taxes into a common pot.
Instead, they fight to make the state their side’s cash machine.
Now ask what a formal reparations regime does in that environment:
It doesn’t just acknowledge diversity. It locks it into statute as a moral hierarchy:
One ancestry group = official “creditor”
Everyone else = official “debtor”
It takes every budget argument and puts a racial overlay on it: “Have they paid us enough yet?”
Trust doesn’t survive that. Why would it?
B) Once You Create a Creditor Class, It Never Closes the Account
Reparations activists sell their project as a one‑time healing event: pay the check, cleanse the sin, move on.
Everything we know about politics says the opposite will happen:
The moment you write the first check, the check becomes the floor, not the ceiling.
Any finite dollar amount can be called a “down payment.”
Any sunset clause can be framed as “they’re trying to cut us off again.”
The incentive of activists and bureaucrats is to keep the grievance alive.
NGOs, commissions, DEI offices, and university centers will literally exist to keep the story going.
Their budgets, careers, and relevance depend on arguing that whatever was paid is not enough.
Every new social problem gets added to the tab.
Slavery → Jim Crow → redlining → mass incarceration → micro‑aggressions → climate injustice → algorithmic bias → whatever comes next.
The narrative can always stretch to include the latest fashionable grievance as “part of the same debt.”
You don’t get a one-off reconciliation event. You get permanent grievance infrastructure.
C) The Reparations Bureaucracy: A Machine Built to Expand Itself
We’ve already seen a preview of this madness in California.
AB 3121 set up a state reparations task force to study slavery’s legacy and recommend remedies.
After years of hearings, they recommended:
Eligibility limited to Black Californians with lineage to an enslaved or free Black person in the U.S. before 1900
A shopping list of cash payments, housing subsidies, and policy preferences
Immediately, a cottage industry appeared:
genealogists
legal clinics
activist organizations
university centers “studying” reparations
lobbyists pushing to turn the task force report into checks
That is before a single large‑scale payment has actually been authorized.
Scale that logic up to the federal level and you get:
A federal reparations bureau (or series of offices) that:
defines who counts as “Black enough” or “descendant enough”,
vets ancestry,
processes appeals,
defends decisions in court.
An ecosystem of:
NGOs and “community partners” paid to “assist” people with applications,
law firms chasing class‑action and eligibility disputes,
academics and consultants writing reports to justify bigger numbers.
Every one of those actors has exactly zero financial incentive to ever say: “That’s enough; we’re done here.”
You’re creating a new permanent client class and a permanent bureaucracy to serve it.
D) Clientelism 101: How You Buy a Voting Bloc
Political scientists have a word for this kind of thing: clientelism—using targeted benefits to lock in loyal supporters.
The logic is simple:
If I send you a check every month because of your group identity, I’m not just a government. I’m your patron.
If my rival threatens to cut that check, they’re not just “fiscally conservative,” they’re “attacking you.”
In that world:
Every election becomes a referendum on keeping or expanding the payout.
Parties that want the Black vote will compete not on general policy competence, but on who will promise more racially earmarked benefits.
Parties that represent the people paying the bill will either:
try to buy their own client groups,
or openly revolt against the system.
You don’t get “racial healing.” You get hardening racial blocs, each with a different definition of justice and a different idea of what the state is for.
E) The Tax Morale Problem: Forcing People to Pay for a Story They Don’t Believe
There’s another layer: tax morale — the willingness of people to pay taxes without cheating.
Modern democracies rely on a basic psychological bargain:
You pay into the pot,
You may not like every line item, but you accept that the state is at least trying to act in the general interest.
Reparations shatter that bargain for a huge chunk of the population.
Consider:
A white or Asian family whose ancestors arrived after 1900, or 1950.
A Hispanic or Middle‑Eastern immigrant whose parents came to the U.S. in the 1980s.
A poor white family in Appalachia that never owned a slave, never owned a business, and whose own ancestors were tenant farmers or coal miners.
If you tax them to pay race‑specific intergenerational cash to other Americans, you are forcing them to underwrite a moral narrative they do not accept, one that often explicitly casts them as “beneficiaries of white supremacy” regardless of their actual history.
That is not normal redistribution. It is compelled ideological participation.
The predictable consequences:
Less willingness to support any taxation.
More tax evasion, more use of gray markets and cash.
Rising support for political actors who promise to blow up or exit the system.
In other words: reparations don’t just move dollars. They attack the perceived legitimacy of the fiscal state by turning taxes into punishment for the wrong ancestry.
Section VII Ledger: The Non‑Monetary Cost Column
Unlike welfare spending or prison budgets, you can’t put a precise dollar figure on:
how much GDP is lost because people in a low‑trust, grievance‑driven society cooperate less,
how many reforms fail because every policy is racialized,
how much human capital emigrates or disengages because its owners no longer feel any stake in a system that treats them as hereditary villains.
But the direction is not in doubt:
Cross‑national evidence: diverse, fragmented societies spend less on broad public goods and have more fights over targeted benefits, hampering growth.
Domestic evidence: rising polarization and racialization of politics track with collapsing trust in institutions and in each other.
From a ledger perspective, this section adds a qualitative but crucial column:
The long‑term cost of a reparations regime is not just more zeroes on the spending side. It is a structural drop in social trust, tax morale, and institutional legitimacy — the exact conditions under which countries become poorer, more corrupt, and harder to govern.
If someone still insists on pursuing reparations, they aren’t just asking for more money. They’re asking to ratify a permanent grievance economy and to cement the idea that the only honest way to do politics in America is by fighting over whose ancestry gets to live at whose expense.
VIII. The Historical Ledger: Blood, Treasure, and Slavery’s Economic Drag
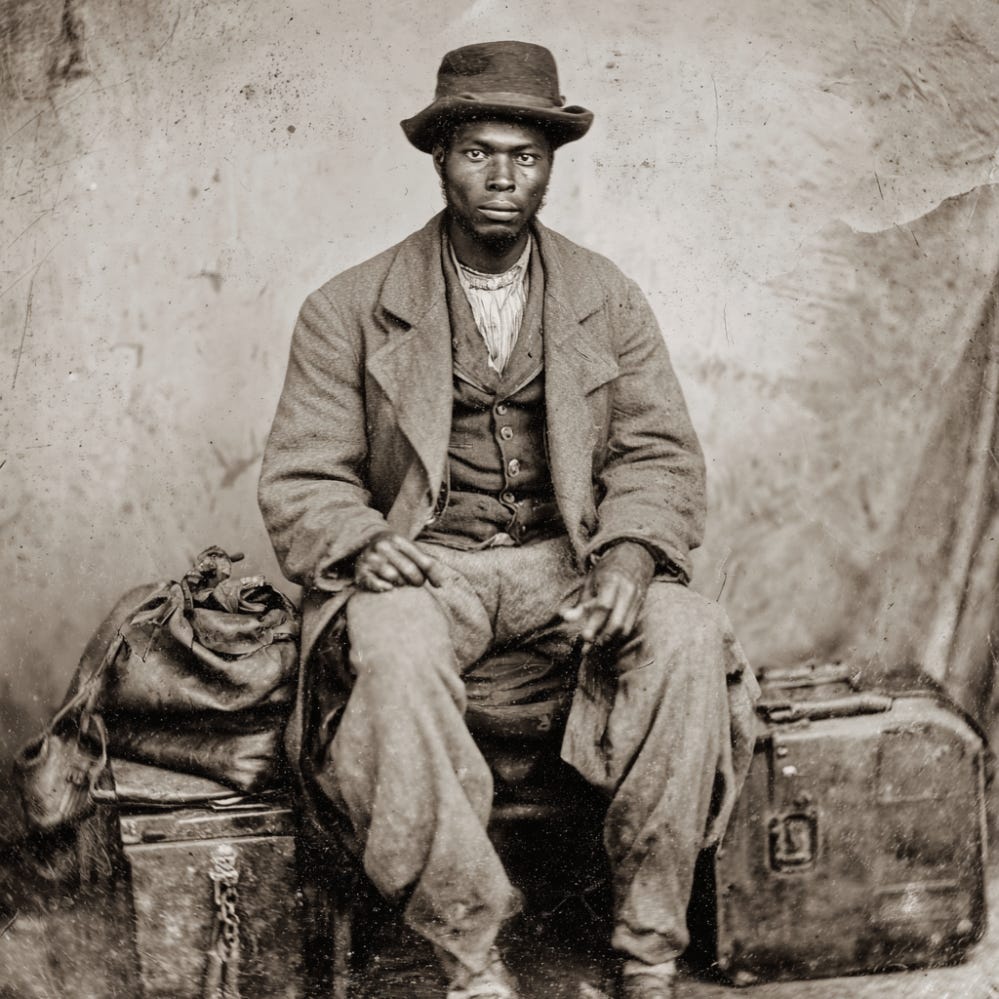
The standard reparations pitch starts from a premise like:
“America’s vast wealth was built on slavery; that wealth is still sitting in white hands; therefore a large slice of it must be disgorged.”
If that premise is incorrect and slavery: (A) reduced long‑run national wealth and if (B) the country already paid an enormous price in blood and treasure to abolish it — then the fiscal “moral math” behind reparations vaporizes.
This section does three things:
Quantifies slavery’s economic drag using the most recent economic history literature.
Prices the Civil War and Reconstruction support in today’s terms.
Adds in the colonization / Liberia experiment as an additional, explicit cost of trying to provide Black sovereignty.
The picture that emerges is not a jackpot of “unpaid slave wealth,” but the opposite: a system that destroyed aggregate surplus for a century, followed by multi‑trillion‑dollar costs to end it.
A) Slavery as Economic Drag, Not the Engine of American Wealth
Modern economic historians have been brutal to the “slavery built America” slogan.
1. Slavery and underdevelopment in the South
Gavin Wright’s “Slavery and the Rise of the 19th Century American Economy” analyzes the claim that slavery “played a leading role” in 19th‑century U.S. growth and concludes it “fails under rigorous historical scrutiny”.
He emphasizes that the slave South:
Discouraged immigration
Underinvested in transportation and infrastructure
Failed to educate the majority of its population
… all of which suppressed long‑run development and human capital in the region.
Bleakley & Rhode (2024, NBER) exploit the 1860 free-slave border (e.g., across the Ohio River) as a natural experiment.
Comparing adjacent counties, they find that on the slave side:
Population density was ~50% lower,
Land use was less intensive,
Farm values per acre were lower, even after controlling for soil, climate, and geography,
… leading them to summarize that: “half of the border region was half underutilized” and that the data do not support the view that slavery maximized local economic performance or that abolition was a costly constraint.
In plainer language: slavery made the South poorer than it otherwise would have been. The “slave economy” enriched a planter elite but depressed land values, capital formation, and immigration at the regional level.
2. Emancipation as the single biggest economic “jump” in U.S. history
The strongest single quantification comes from Hornbeck & Rotemberg’s 2023 NBER paper: One Giant Leap.
They:
Estimate annual income per person on free Southern farms at about $40 (1860 dollars).
Estimate the private cost of enslaved labor to slaveholders at about $60 per person (i.e., what the enslaver effectively “paid” in upkeep plus capitalized value).
Use value‑of‑statistical‑life methods to estimate the true cost of enslavement to the enslaved themselves (coercion, lost autonomy, mortality risk, etc.) at roughly $420 per person per year.
The gap between what enslavers paid and what enslaved people “paid” in welfare terms (c − r in their model) is roughly:
420 − 60 ≈ $360 per enslaved person per year (in 1860 dollars)
With about 4 million enslaved people in 1860, that implies an annual deadweight loss on the order of:
$360 × 4,000,000 ≈ $1.44 billion per year (1860 dollars)
U.S. GDP in 1860 is estimated at about $4.3 billion. (Wikipedia)
So, by Hornbeck & Rotemberg’s conservative calibration, the social deadweight loss of slavery—counting the costs borne by the enslaved, not just the profits to owners—was on the order of:
~33% of total GDP per year in the late antebellum period.
That doesn’t mean output was literally 33% lower; it means that once you value the cost of coercion and “social death”, the system destroyed roughly a third of the country’s potential surplus every year.
Hornbeck & Rotemberg explicitly state that emancipation, once you include those social costs, produced:
“the single greatest annual increase in aggregate economic surplus, by far, in American history,” and that the gain from ending slavery is over 7 times larger (as a share of GDP) than the gain from hypothetically eliminating all U.S. carbon emissions.
Implication:
There is no giant net “slave surplus” sitting in the modern American economy waiting to be carved up.
The institution itself burned enormous surplus in real time, and the abolition of slavery was a massive positive shock, not an economic sacrifice made solely for moral reasons.
If you want to do ledger logic, that matters: the “system” already paid much of the cost internally, in the form of lost growth and wasted human potential—before we even get to the Civil War.
Rough cumulative drag estimate:
If we take that ~$1.4 billion/year deadweight loss as representative only for the final 20 years before the war (a conservative window), the cumulated social loss is:
$1.4 billion × 20 ≈ $28 billion (1860 dollars)
Using a simple CPI conversion (~39× from 1860 to today), that alone translates into ~$1.1 trillion in today’s price level.
Using the “share of GDP” method (33% of one year’s GDP per year) would yield an even larger present‑value equivalent when scaled to today’s economy, easily into the multi‑trillion‑dollar range.
Again: this is lost surplus, not a pot of money hidden in white bank accounts.
B) The Civil War as an Enormous One‑Time “Payment”
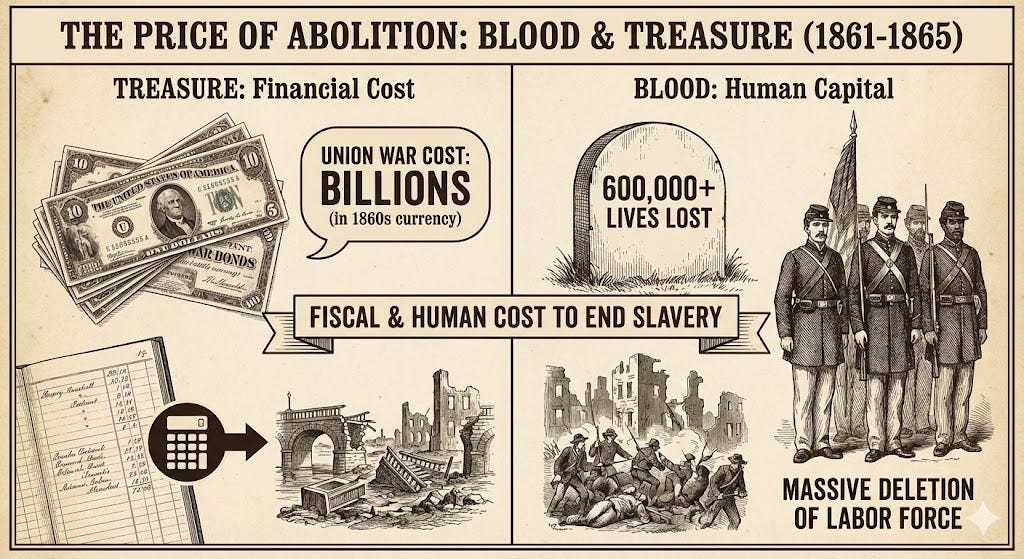
If slavery itself destroyed surplus, the Civil War was the explicit, catastrophic bill to abolish it.
1. Direct cost in 1860 dollars
Claudia Goldin and Frank Lewis’s classic estimates (1975) break the economic cost of the Civil War into:
Government expenditures (Union + Confederacy): ≈ $3.3 billion
Value of human capital lost (deaths): ≈ $2.2 billion
Physical destruction: ≈ $1.5 billion
… for a total of about $7 billion in 1860 dollars, equivalent to roughly two full years of pre‑war U.S. GDP. (ECWC)
More recent work by the Atlanta Fed similarly cites a $6.7–7 billion direct cost (including destruction of human and physical capital). (Atlanta Fed)
2. Translating that into today’s scale
The MeasuringWorth project, which specializes in historical money comparisons, notes that:
$6.7 billion in 1860 is equivalent to about $44.3 trillion today, if you scale by share of GDP—over 150% of current U.S. GDP.
That is the right comparison for a war that absorbed 2 full years of national output.
So, if we insist on ledger thinking and we treat the war as fundamentally about slavery (which is exactly what most modern scholarship does), then on the abolition side of the ledger we have:
~620,000–750,000 military deaths, the majority Union, overwhelmingly white.
A direct economic cost equivalent to $40–45 trillion in today’s economy.
You don’t have to lean on Lincoln’s Second Inaugural (“every drop of blood drawn with the lash shall be paid by another drawn with the sword”) to make the point:
On a raw cost basis, the United States already paid an amount comparable to wiping out 1–2 years of the entire modern economy to end slavery. That dwarfs even the most aggressive modern reparations proposals.
From a “hardest‑hitting” perspective: if someone wants to talk about a national debt to slavery, it is very easy to argue that the Civil War’s blood and treasure paid that debt in full 160 years ago.
C) Reconstruction Support: Freedmen’s Bureau and Related Measures
After the war, the federal government did not simply walk away. It created what was, for its time, a remarkably interventionist apparatus targeted explicitly at former slaves.
1. Freedmen’s Bureau: direct fiscal support
The Freedmen’s Bureau (Bureau of Refugees, Freedmen, and Abandoned Lands), established in 1865, was tasked with providing food, shelter, medical aid, schooling, labor contract supervision, and some land administration to freed people and war refugees.
Key facts:
It operated roughly 1865–1872 (with real activity concentrated in the first ~5 years).
At its peak spending period (FY 1868), the Bureau’s cost was about $4 million, roughly 1% of the entire federal budget that year. (ORE)
It distributed 15 million rations of food to freed African Americans and 5 million rations to impoverished whites, helped establish schools, and funded teachers and infrastructure. (Wikipedia)
We do not have a single neat “total cost” number, but if peak spending was $4M and earlier years were in the $1–3M range, a conservative cumulative estimate is on the order of:
~$15–20 million in 1860s dollars in direct federal outlays over the life of the Bureau.
Using a simple inflation factor (~39×) that’s:
~$600–800 million in today’s price level.
If you scale by share of GDP instead of just prices (since federal spending then was tiny relative to the economy), the “present‑equivalent” effort is easily in the tens of billions of dollars range.
Crucially:
This was explicitly race‑targeted in practice, if not always in statute. The whole point of the Bureau was to cushion the transition from slavery and prevent freed people from collapsing into starvation and chaos.
It was joined by state‑level Reconstruction governments that taxed largely white property holders to fund new public school systems, Black and white, in places that had never had such systems before.
So, on the historical side of the ledger, you can legitimately class the Freedmen’s Bureau and Reconstruction educational spending as 19th‑century proto‑reparations.
2. The Southern Homestead Act & related efforts
The Southern Homestead Act of 1866 attempted to open up millions of acres of federal land in the South to poor farmers, Black and white, at low prices.
In practice, most of the land ended up in white hands due to discrimination and practical barriers, but the law still represents a formal attempt at asset transfer in which freedmen were explicitly counted as intended beneficiaries.
Even where the programs failed or were undermined, the political will, legislative effort, and administrative cost are part of the historical bill the country has already run up trying to address slavery’s aftermath.
D) Colonization & Liberia: A Costly Offer of Sovereignty
Before the war, and overlapping with it, the U.S. elite pursued another “solution” to slavery: exporting free Blacks and some emancipated slaves to Africa.
1. Money and logistics
The American Colonization Society (ACS) was formed in 1816 to send free African Americans to Africa. It established the colony that became Liberia.
Between 1820 and the Civil War, roughly 11,000–15,000 African Americans and around 3,000 Afro‑Caribbeans were transported to Liberia.
ACS pamphlets from the period estimate transport costs at about $20 per person, plus $6–10 per head for post‑arrival support, implying a per‑capita cost of roughly $26–30. (LOC)
If we take 20,000 emigrants × ~$30, that’s around $600,000 in 19th‑century dollars purely in direct transportation and initial provisioning, before counting administrative overhead, ship charters, and sustained subsidies.
In practice, ACS finances combined:
Private philanthropy,
State appropriations (e.g., from Virginia and other states), and
Periodic federal support and naval backing for the colony’s survival
We don’t have a precise, unified expenditure total, but the order of magnitude is low millions of dollars between the 1820s and the Civil War—easily tens to hundreds of millions in today’s money, depending on how you scale.
2. What the settlers did with that sovereignty
The emigrants and their descendants formed an elite Americo‑Liberian ruling class that started practicing slavery. Freed Black slaves from the American South began enslaving Africans in Liberia!
The ruling class:
Modeled its culture and political institutions explicitly on the antebellum American South
Colonized and subordinated the indigenous majority, who did not gain birthright citizenship until 1904.
Historian accounts and policy summaries put it bluntly:
The settlers carried their culture and tradition with them while colonizing the indigenous population.
By the early 20th century, a League of Nations-linked commission investigating Liberia found forced labor and practices “analogous to slavery” in the recruitment of indigenous people for work, including shipments to plantations on Fernando Po. (Wikipedia)
So, from a ledger perspective:
The U.S. and its philanthropists financed ships, supplies, and diplomatic protection to create a Black‑ruled republic.
The resulting Americo‑Liberian elite then replicated a hierarchy that looked uncomfortably like slavery over local Africans.
This doesn’t negate American slavery but it does demolish any childish binary of “whites as eternal oppressors” and “Blacks as eternal victims.” There were real costs paid by Americans to provide sovereignty; what happened with that sovereignty is morally and politically mixed at best.
Section VIII Ledger Subtotal
Slavery’s social deadweight loss: ≈ $1–2 trillion in today’s terms (lost aggregate surplus) — negative for everyone (no “hidden pot of wealth”).
Civil War to end slavery: ≈ $40–45 trillion in today’s terms (GDP-share equivalent of $6.7–7B in 1860) — massive payment by the polity to abolish slavery.
Freedmen’s Bureau & Reconstruction support: Direct outlays $15–20M in 1860 dollars ⇒ tens of billions today — targeted transitional support to freedpeople.
Colonization / Liberia project: Low millions in 19th-century dollars ⇒ tens to hundreds of millions today — costly offer of Black sovereignty.
If we’re doing moral accounting, the “slave system” destroyed immense surplus while it operated, and the United States then blew the equivalent of tens of trillions of dollars and hundreds of thousands of lives to kill it, plus additional billions in today’s terms on reconstruction and colonization experiments.
There is no coherent sense in which a big, untouched “slavery profit” is still sitting on the table in 2025 waiting to be cashed out.
IX. The Reparations Bureaucracy: Fraud and the Lineage Trap (Pigford on Steroids)
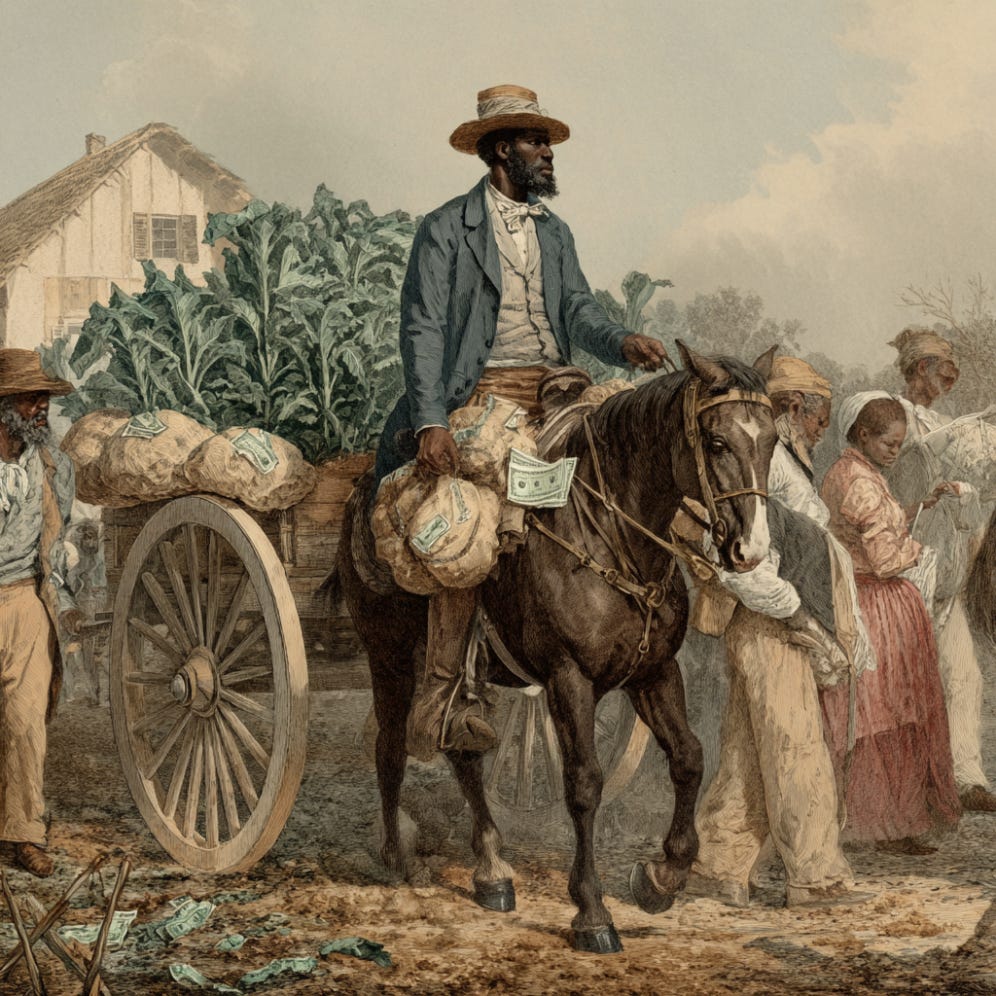
Everything up to now has dealt with what has already been paid or destroyed.
Now shift to what a federal reparations program would actually look like in practice.
The fantasy is simple: a wise commission calculates a fair number, the government cuts checks to the deserving descendants of U.S. slaves, and everyone walks away “healed.”
In reality, you get:
A national ancestry bureaucracy trying to police bloodlines with incomplete records
A Pigford-sized fraud problem scaled up by three orders of magnitude
Administrative and error costs that alone can easily run into hundreds of billions or trillions of dollars on top of any advertised “headline” payout
A) Lessons from Past Payouts
Pigford v. Glickman is what happens when you mix historical grievance, weak documentation, and guaranteed payouts.
The case:
Pigford was a 1999 class‑action against USDA alleging discrimination against Black farmers in farm loans and assistance from 1981–1996.
It created a streamlined Track A: for a typical claimant, a $50,000 payment plus loan forgiveness, with a very low evidentiary bar: essentially, show you “tried to farm,” applied for USDA help, and believed you were discriminated against.
The numbers are where it gets interesting:
USDA and class counsel originally thought ~2,000 farmers might qualify.
In practice, more than 22,000 Track A claims were processed; about 13,300 were approved, and nearly $1 billion was paid out under the first consent decree alone.
In total, including “Pigford II,” Congress ultimately appropriated about $2.3 billion for Black farmer discrimination settlements.
Most damning, from the standpoint of program design:
A Congressional Research Service report notes that about 94,000 people filed initial claims, even though the farm census over the relevant period counted far fewer Black farm operators. (NALC)
CRS is polite about why those numbers don’t match (ECR); but basic logic isn’t:
When your claims pool is several times larger than the underlying eligible population, you have built a magnet for opportunists.
Pigford is not proof that every extra claimant was fraudulent. But it is proof that:
Loose standards + racial grievance + cash award = surging claims well beyond the plausible eligible population.
Now scale that up:
Pigford involved tens of thousands of potential claimants.
A national reparations scheme is aimed at tens of millions of potential claimants.
If you’re serious about a $1–12 trillion program, you cannot pretend Pigford is a one‑off curiosity. It’s a preview of what happens when you attach big money to historical identity and self‑attestation.
B) The Fraud Baseline: What Big Cash Programs Actually Attract
If that sounds alarmist, look at the federal government’s own recent experience.
The Government Accountability Office (GAO) now estimates that fraud in COVID‑era unemployment insurance alone was between $100–135 billion, about 11–15% of all UI benefits paid during the pandemic. (GAO)
That’s just one program, over three years, with existing ID systems in place.
Other pandemic relief programs show similar patterns:
SBA inspector general estimates about $136 billion in fraud in one emergency loan program (EIDL) and $64 billion in PPP fraud. (FBI)
So we know, from fresh, audited data, that:
When you stand up a large pot of federal money with hurried vetting, double‑digit fraud rates are normal, not exceptional.
Now overlay that onto reparations:
Leading reparations advocates like William “Sandy” Darity explicitly say their plan would require $10–12 trillion in federal spending to close the racial wealth gap. (Brookings)
Note: The “racial wealth gap” has zero to do with slavery. If you think it does, you’ve completely deluded yourself with propaganda and illogic and you fail to understand evolution between groups which led to different distribution rates of various skills that are in-demand in the modern economy.
Take their own number as the baseline.
Suppose you manage a heroic fraud‑control performance and hold improper payments (fraud + error) to “only” 10% of disbursed funds—better than UI’s 11–15% experience. (GAO)
That implies:
$1–1.2 trillion in misdirected or fraudulent reparations payments.
Not counting:
The cost of investigating, litigating, and trying (usually unsuccessfully) to claw any of that back.
And that’s before you talk about the bureaucracy required to decide who counts as eligible in the first place.
C) Lineage as Law: Turning Genealogy into a Federal Entitlement
California is the testbed for lineage‑based reparations.
Assembly Bill 3121 (AB 3121) created a state task force “to Study and Develop Reparation Proposals for African Americans, with a Special Consideration for African Americans Who are Descendants of Persons Enslaved in the United States.” (House.gov)
In 2022, after bitter debate, the task force voted 5–4 to limit eligibility to Black Californians who can trace their lineage to an enslaved or free Black person living in the U.S. before the end of the 19th century. (CalMatters)
That sounds precise. On the ground, it means:
Some Black residents of California will be deemed “eligible,” others “ineligible,” based not on anything they personally experienced, but on whether they can produce documentation that a specific 19th‑century ancestor was in the U.S.
The state has to build a system to verify those claims—a miniature federal ancestry office.
Follow‑on proposals show where this leads:
AB 7 (2025) would have explicitly allowed California universities to give admissions preference to “descendants of slavery, as defined,” i.e., applicants who can prove direct lineage to someone enslaved in the U.S. before 1900.
The Legislature passed it; Governor Newsom vetoed it as “unnecessary,” but the bill’s own fiscal analysis warned of “potentially significant General Fund costs in the high hundreds of thousands of dollars” just for litigation around that one ancestry preference. (TrackBill)
That’s a trivial dollar figure by federal standards, but a critical design point:
Even a narrow, state‑level, lineage‑based preference is expected to kick off expensive litigation and bureaucratic overhead. A national cash entitlement based on lineage would multiply that problem by several orders of magnitude.
D) The Records Don’t Support Clean Lineage Lines
On paper, “descendant of U.S. slavery” sounds like a crisp category. In the archives, it’s not.
Key constraints:
Prior to the Civil War, federal censuses did not name enslaved people.
From 1790–1840, enslaved persons appear only as counts under the enslaver’s name. (Archives.gov)
In 1850 and 1860, there are separate “Slave Schedules” listing each enslaved person by age, sex, and color under the owner’s name—no personal names for almost all enslaved individuals.
The 1870 federal census is the first one that names formerly enslaved African Americans individually.
Genealogists themselves emphasize how hard this makes things:
To connect a named Black person in 1870 back to a specific enslaved person in 1860, you have to guess based on age, sex, location, and likely owners, because the 1860 slave schedules give no names — just a list like “female, 16, black” under some white owner’s name.
That’s fine for personal family history, where “best‑effort” is good enough.
As the basis for federal cash entitlements, it’s a nightmare:
Millions of people whose ancestry is real but undocumented will be told: “You don’t qualify.”
Millions of others will have plausible but unprovable narratives that still have to be accepted or rejected by some office somewhere.
Every rejection becomes lawsuit fodder; every approval on thin evidence looks like favoritism to someone paying the bill.
You don’t get a clean, frictionless ancestry test. You get tens of millions of people forced into a federal genealogy lottery.
E) Genetic Admixture: Everyone Is Part Everything
Even if the records were clean, the biology isn’t.
Modern genetic work finds that African Americans on average are heavily admixed:
A mechanistic admixture model by Mooney, Pritchard, and co‑authors (2022) notes that African Americans typically have about 75–85% African and 15–25% European ancestry on average. (arXiv)
Their genealogical interpretation:
For a typical African American born in the 1960s, tracing all lines back to source populations yields hundreds of distinct ancestors, including dozens of European ancestors. (arXiv)
That implies:
Many “Black American descendants of slavery” have lineages that include both enslaved and enslavers, Black and white, sometimes Native as well.
Many self‑identified whites, especially in the South, have nontrivial African ancestry if you go back far enough; in a large‑scale program, some of them will be genetically closer to particular enslaved lineages than some self‑identified Black people.
No matter how you draw the line—self‑ID, fractional ancestry thresholds, documented lineage—you will inevitably:
Include some people whose connection to slavery is tenuous or mostly symbolic, and
Exclude some people whose actual lineage includes enslaved ancestors, simply because the paper trail broke.
And you will be paying bureaucrats to adjudicate:
Who is “Black enough”? Who is “enslaved enough”? Which branches of a tangled family tree “count” for money?
That is not “healing.” That is reviving one‑drop logic with cash attached.
F) Administrative Cost: The Hidden Trillion
Big federal-benefit systems are not free to run even when eligibility is straightforward.
For instance:
Social Security’s administrative cost is around 1% of benefits, and it doesn’t require complex historical verification; eligibility is automatic once you’ve paid in.
Means‑tested programs with fraud controls, caseworkers, appeals, and audits routinely run higher admin overhead.
Now apply that to a Darity‑style reparations plan:
Suppose a national program pays out $10–12 trillion to “eligible Black descendants of U.S. slavery” over a decade. (Brookings)
Administering that with ancestry verification, documentation review, appeals, and litigation is not a 1% overhead exercise. Even a very efficient bureaucracy could easily run 5–10% of program cost in admin and compliance.
That implies:
$500 billion to $1.2 trillion just to run the program, on top of the checks.
Throw in:
inevitable fraud and improper payments in the 10–15% range we’ve already seen in large emergency programs (GAO)
plus decades of litigation around borderline cases, moving goal‑posts, and constitutional challenges,
… and the “all in” cost of a $10–12T reparations scheme can easily climb into the $12–15T range, with $1–2T of that doing nothing but:
funding bureaucracy
paying lawyers
and cutting checks to people who shouldn’t have gotten them under the advocates’ own rules
Section IX Ledger Subtotal
This section is about mechanism costs.
If you try to implement a national lineage‑based reparations scheme on the scale its leading advocates demand, the ledger for this piece alone looks roughly like:
Pigford‑style inflation of claimants
Expected claims in Pigford: ≈ 2,000.
Actual initial claimants: ≈ 94,000; Track A claims ≈ 22,500; ≈ $1B paid in first round, ~$2.3B including Pigford II.
Demonstrates that loosely verified historical‑discrimination payouts produce claim numbers far beyond the underlying eligible population.
Baseline fraud rate from large federal payouts
COVID unemployment programs: GAO estimates $100–135B of fraud (≈11–15% of benefits).
Other relief programs (PPP/EIDL) show tens of billions more in fraud.
Realistic expectation: ≥10% of any huge, rapidly deployed benefit program will be lost to fraud/improper payments without extraordinary controls.
Lineage verification and admin overhead on a $10–12T scheme
If program admins somehow hold admin + compliance overhead to 5–10%, that’s $500B–$1.2T in bureaucracy.
If fraud/improper payments run at even 10%, that’s another $1–1.2T in misallocation.
Combined non‑benefit costs: on the order of $1.5–2.4 trillion.
None of that pays for a single school, road, or hospital. This would be pure drag required to make an ancestrally‑targeted cash machine function at national scale.
Stack that on top of:
the trillions already spent on welfare,
the trillions lost to crime and disorder,
the trillions sunk into DEI and racial preferences,
and the tens of trillions equivalent already blown in the Civil War,
… and the picture is straightforward:
A national reparations bureaucracy would not be the start of “justice.” It would be Pigford on steroids—a vast, expensive, fraud‑vulnerable machine tasked with turning murky 19th‑century genealogy into 21st‑century checks, while burning another couple trillion dollars in the process.
X.) Historical Nuance: No Monolithic Victims, No Monolithic Debtors
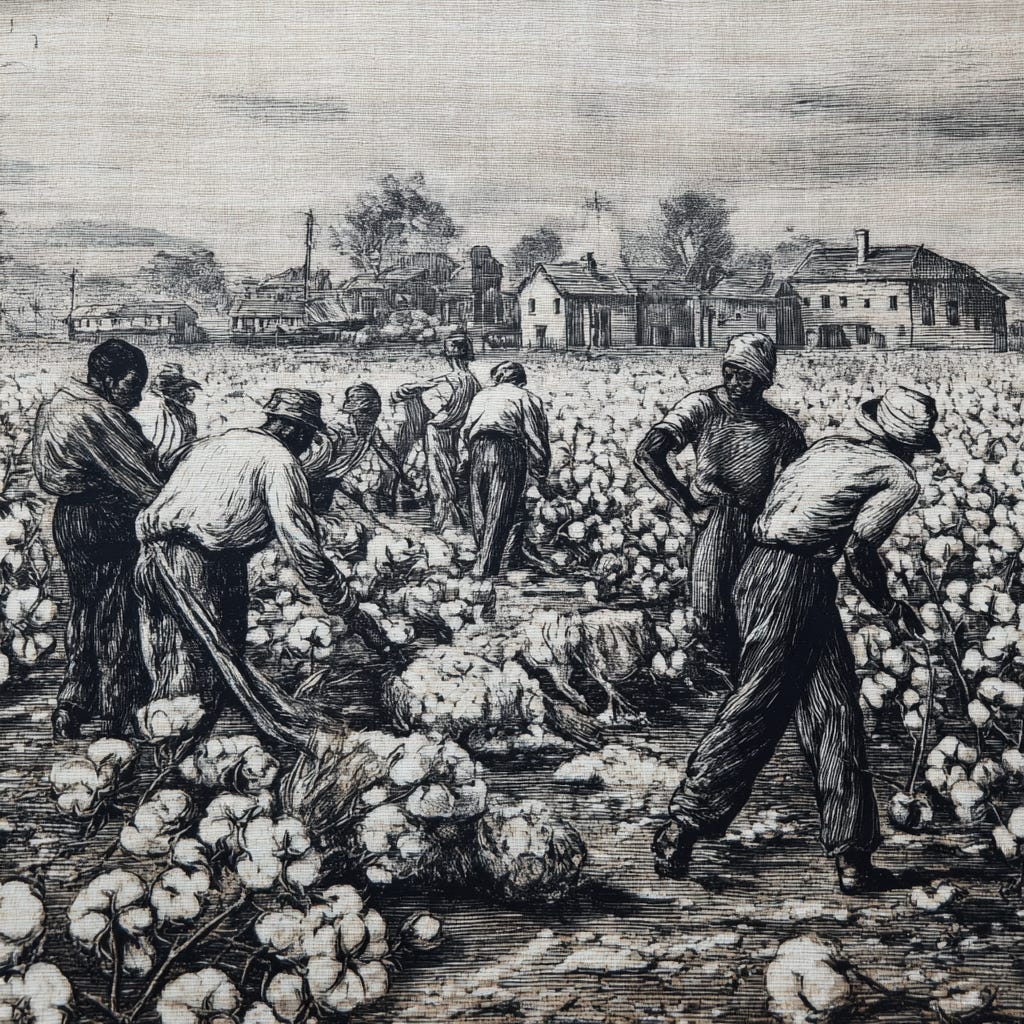
The reparations story the public is sold is cartoon‑simple:
White America built its wealth on Black slavery. Black America has only ever been the victim. Therefore “whites” (plus whoever else is productive) owe an open‑ended debt to “Blacks.”
That story collapses the second you actually open a census table or an economic history book.
Once you do, at least four facts jump out:
A non‑trivial number of free Black Americans owned slaves—sometimes in large numbers.
Native American nations in what is now the U.S. actively owned and exploited Black slaves.
African states and elites provided the bulk of captives for the Atlantic slave trade and suffered their own huge long‑run losses from it.
A massive share of today’s Americans—white, Asian, Hispanic, African, Middle Eastern—descend from people who arrived after 1865, long after U.S. slavery was dead.
If you’re trying to build a clean “guilty race vs innocent race” model, you’re out of luck.
A) Black Slave‑Owners in the United States
Let’s start with the part almost no one wants to talk about: free Black slaveholders.
Carter G. Woodson’s classic compilation Free Negro Owners of Slaves in the United States in 1830 used the federal census to identify them. His data (later summarized by Halliburton and others) show:
In 1830, there were about 319,599 free Blacks in the U.S. (CWT)
That year, 3,775 free “Negroes” owned a total of 12,760 slaves. (JSTOR)
So roughly:
About 1–1.2% of free Blacks were slaveowners.
Collectively, they owned 12,760 human beings—on average, 3–4 slaves per Black owner, with some owning far more.
Two famous examples:
William Ellison (South Carolina): born enslaved in 1790, freed in 1817, became a cotton‑gin maker and planter. By 1860, he owned 63 slaves at his death and had owned up to 171 at one point, plus nearly 900 acres of land—making him one of the largest slaveowners in his region. (Wikipedia)
Marie Thérèse Coincoin / Metoyer family (Louisiana): free people of color who built a large plantation complex and ultimately owned hundreds of slaves; some accounts put the Metoyer holdings at over 300 enslaved people. (Wikipedia)
These were not all “benevolent custodians of relatives.” They ran commercial plantations, profited from slave labor, and—in Ellison’s case—supported the Confederacy.
Ledger implication:
Any reparations theory based purely on race (“all Blacks = descendants of victims only, all Whites = descendants of oppressors only”) is already dead.
If you’re going to assign hereditary debt, you would logically have to say:
some Black lineages owe (as descendants of slaveholders)
some White or mixed lineages are owed (as descendants of poor whites, abolitionists, or Black‑adjacent families),
and many people have both in their tree
No one pushing reparations wants to run that calculation.
B) Native American Slave‑Owners and Black Slaves in Indian Territory
Now zoom out from Black and White and look at Indian Territory.
The “Five Civilized Tribes”—Cherokee, Choctaw, Chickasaw, Creek (Muscogee), and Seminole—didn’t just “have some slaves.” They integrated chattel slavery into their own economies.
Among the Cherokee, enslaved Africans rose from about 600 in 1809 to ~1,600 by 1835, and about 4,000 by 1860 after removal to Indian Territory. (Wikipedia)
Scholars estimate that, on the eve of the Civil War, these five tribes collectively held on the order of 7,000+ enslaved Black people in Indian Territory. (ECW)
Key point:
Cherokee slaveholding rates (as a share of households) were comparable to white Southern elite patterns—a small planter class owning large numbers of slaves.
These tribes:
Brought their slaves with them on the Trail of Tears.
Fought, in many cases, for the Confederacy, partly to protect their own slave property.
The 13th Amendment did not automatically free slaves in Indian Territory; separate treaties were required after the war to end slavery there.
Ledger implication:
If reparations logic is “those who benefited from slavery owe those who suffered,” then Native nations (specifically the Five Civilized Tribes) would logically be on the debtor side with respect to their own Black freedmen.
In fact, to this day, there are ongoing fights over whether the “Freedmen” descendants in some tribes (e.g., Cherokee) must be recognized with full tribal citizenship and benefits. (Alaina E. Roberts)
You don’t hear modern reparations advocates demanding Native‑to‑Black reparations in Oklahoma. Why? Because the politics are selective. The moral accounting is not consistent; it’s aimed one way.
C) African States and Elites: The Supply Side of the Atlantic Trade
Reparations activists tend to frame the Atlantic slave trade as something done to Africa by Europeans. This is mostly not true. (Wikipedia)
The consensus in mainstream scholarship is:
The vast majority of Africans carried to the Americas were sold to European and American traders by African intermediaries—kings, warlords, and merchant elites—rather than being captured en masse by European raiders.
European traders typically stayed near the coast and established forts; African suppliers captured, marched, and sold captives from the interior.
Nathan Nunn’s survey of Africa’s four major slave trades (Atlantic, trans‑Saharan, Red Sea, Indian Ocean) estimates that:
Between 1400 and 1900, about 20 million people were taken as slaves from Africa across all routes. (CEPR)
By 1800, Africa’s population was roughly half of what it would have been without the slave trades.
Mechanics:
Captives were acquired by:
wars and raids specifically staged to generate slaves
kidnapping
and punishment for “crimes” that were often a pretext for sale
The long‑run damage to Africa is catastrophic and well‑documented: lower trust, weaker states, worse institutions, and lower contemporary income in the regions that supplied the most slaves.
Ledger implication:
The Atlantic system was a joint venture between European buyers and African sellers.
If you treat the transatlantic trade as a debt to be paid, that debt is not traceable solely to “white America.” African elites were on the profit side of the ledger at the point of sale and on the loss side centuries later in terms of underdevelopment.
Once you admit that, any simple “white vs Black” reparations model falls apart. You’d need a global, multi‑century clearinghouse for mutual atrocities on both continents.
No one is proposing that. Because again, the politics are selective.
D) A World Full of Other Slaver Societies
Slavery was not uniquely American or uniquely white.
Before and alongside the Atlantic trade:
The trans‑Saharan, Red Sea, and Indian Ocean trades moved millions of African captives into North Africa, the Middle East, and across the Indian Ocean centuries before the U.S. existed.
The Islamic world ran slave systems from the 7th century onward, sourcing people from Africa, Eastern Europe (Slavs), Central Asia, and more.
None of this excuses American slavery; it locates it in a much larger pattern:
Slavery has been a near‑universal human institution.
If we open the reparations books globally and historically, the number of groups with plausible claims and counter‑claims is almost infinite.
Yet in U.S. politics, all of that is bracketed out so that one very narrow moral story: American whites → American Blacks — can be treated as if it were the entire field.
E) Mass Immigration and Non‑Complicity: Who Exactly Is Being Taxed?
Even if you ignore all the historical nuance above and say, “Fine, we’re only talking about the United States; the debtor is ‘America’ as a continuous entity,” you still run into a basic demographic fact:
A huge share of people living in the U.S. today descend from families that arrived after slavery ended.
Some key numbers:
The share of foreign‑born residents in the U.S. was 9.7% in 1850, and then hovered between 13–15% from 1860 to 1920, as millions of Europeans (Italians, Poles, Jews, Slavs, Irish, etc.) poured in. (Census.gov)
A post‑1965 immigration wave brought about 59 million immigrants to the U.S. between 1965 and 2015 alone. (Pew Research)
By 2015, there were 45 million foreign‑born residents, and as of 2025, about 53.3 million, roughly 15.8% of the U.S. population—the highest share since 1890.
Layer in their U.S.‑born children and grandchildren, and you get:
Tens of millions of whites, Hispanics, Asians, Africans, Middle Easterners, etc., whose family history in the U.S. starts after 1865, often after 1900, sometimes after 1965.
None of their ancestors:
owned slaves in the U.S.
voted for pro‑slavery laws
or participated in Jim Crow politics
Yet every serious national reparations plan proposes to:
Tax all current residents (or all “whites” plus anyone else with income)
Send checks exclusively to one ancestry‑defined group
From a ledger perspective:
You are telling a Vietnamese refugee who arrived in 1995, a Syrian who arrived in 2010, or an Indian software engineer who arrived in 2012 that they must pay, via federal taxes, for a crime committed by a different country’s elite, in a different era, before their ancestors ever set foot here.
You are telling a white American whose great‑grandparents arrived from Italy in 1900, or from Poland in 1920, that they are a hereditary debtor to a “system” they never participated in and had no economic stake in.
There is no sane version of “contract” or “justice” where that makes sense. It is collective guilt by phenotype.
Section X Ledger: Why the Moral Debtor Category Is a Mess
Quantitatively, this section doesn’t add another new trillion to the money column; instead it shreds the idea that “white America” is a coherent, morally indebted bloc and “Black America” a purely victimized one.
What we can summarize numerically:
Black slave‑owners in the U.S. (1830):
3,775 free Blacks owning 12,760 slaves, out of ~319,599 free Blacks.
Native American slaveholding:
Five Civilized Tribes collectively holding thousands of Black slaves (Cherokee alone ~4,000 by 1860), with slaveholding rates among their elites comparable to white Southern planters.
African participation and losses in the slave trades:
About 20 million slaves taken from Africa across four major trades (Atlantic + three others).
By 1800, Africa’s population perhaps half what it would have been absent these trades.
Post‑slavery immigration/non‑complicity:
Foreign‑born share in U.S. 13–15% from 1860–1920, reflecting massive European inflows.
59 million immigrants arriving 1965–2015; 53.3M foreign‑born residents in 2025 (~15.8% of population), plus their U.S.‑born descendants.
Put this together and the high‑level point is:
There is no way to draw a clean racial line between “historic perpetrators” and “historic victims.” The reality is a tangled web of slaveholders and slaves across Black, Native, African, European, and immigrant lineages.
Any reparations scheme that:
treats all self‑identified Black Americans as pure creditors, and
treats all non‑Black taxpayers (or all “whites”) as pure debtors,
is not doing history. It’s doing myth‑making with a Treasury checkbook.
From the standpoint of the ledger you’re building, this section is the moral capstone:
The economic side already shows that the “debt” has been paid and then some.
The historical side shows that even if a debt remained, there’s no non‑insane way to assign it by race in 2025.
Once you admit that, what’s left is not a justice project. It’s a political demand for a permanent race‑based annuity, dressed up in historical language.
XI. The Human Capital Reality: Why Cash Cannot Fix a Skill Gap
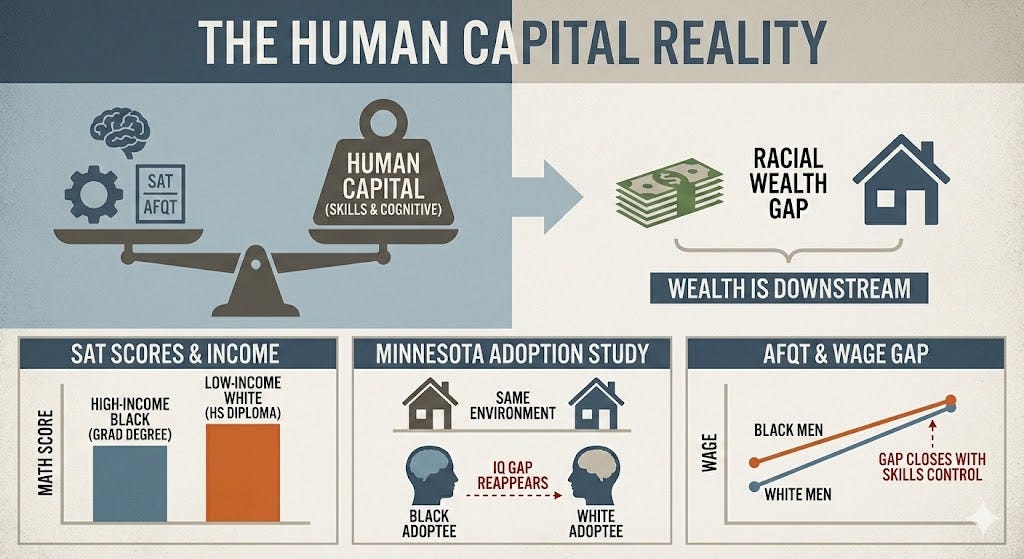
The logic of reparations rests on a “blank slate” fantasy: the idea that all racial and ethnic groups have identical innate potential and that any disparity in outcome is solely the result of “resource deprivation.”
This is not just wrong; it is empirically disproven. The wealth gap is not a cause of dysfunction; it is a downstream effect of the human capital gap. We know this because we have tested every variable—cash, environment, and racism—and the gap persists.
A) The “Poverty Causes Failure” Myth
Reparations advocates claim that poverty drives low test scores and high crime rates. If that were true, then poor Whites and poor Asians would show the same pathologies as poor Blacks. They do not.
The Test Score Inversion: Data from the College Board consistently shows that White students from the lowest income bracket (families earning <$20,000) outscore Black students from the highest income bracket (families earning >$200,000) on the math SAT.
The Asian Control Group: The disparity is even more humiliating when comparing Black and Asian students. Asian students from the poorest quintile consistently outperform Black students from the wealthiest quintile.
The Conclusion: If high-earning Black parents with graduate degrees cannot close the academic gap for their own children, a government check will not do it. The deficit is not financial; it is cognitive.
B) The “Poverty Causes Violent Crime” Myth
The same logic applies to violence. We are told that “poverty causes crime,” yet this relationship collapses when you control for race. (InquisitiveBird)
Poor Whites vs. Wealthy Blacks: Violent crime rates in poor, Opioid-afflicted White Appalachian counties are significantly lower than violent crime rates in middle-to-upper-class Black suburbs.
The Asian Anomaly: Historically low-income Asian enclaves (Chinatowns) have rarely suffered the levels of homicide and violent disorder seen in Black neighborhoods with similar or higher income levels.
Poverty does not compel people to shoot each other. Low impulse control and low future time orientation do. These traits are highly heritable and are not cured by cash transfers.
C) The UBI Failure: We Just Ran the Experiment
We do not have to guess what happens when you give people “free money” to fix their lives. We just tested it.
The OpenResearch Study (2024): Backed by Sam Altman, this study gave low-income recipients $1,000/month for three years with no strings attached—a perfect micro-reparations simulation. (OpenResearch)
The Results: It failed. Recipients worked less, earned less (excluding the transfer), and showed no significant improvements in physical health or long-term human capital formation.
Cash transfers do not build wealth; they subsidize consumption and leisure. A reparations windfall would result in a massive, temporary consumption boom (benefiting the corporations that sell consumer goods) followed by a return to the status quo.
D) The Immigrant Paradox: If America is Racist, Why Do Nigerians Win?
The “systemic racism” narrative relies on the idea that American society is rigged against Black skin. This creates an unexplainable paradox: Black immigrants.
The Genetic Elite: Nigerian-Americans are one of the most educated and successful groups in the United States, often out-earning Whites.
The Selection Filter: This is not because Nigeria has better schools than Chicago. It is because U.S. immigration policy acts as a cognitive filter. We import the top 1% of the Nigerian cognitive distribution (doctors, engineers, scientists); this is not representative of the average/median Nigerian.
The Lesson: When you select for high human capital, “systemic racism” magically disappears. These immigrants are Black, yet they succeed. This proves that the barrier to success for native-born Black Americans is not their skin color or “white supremacy”—it is their own human capital profile.
E) Controlling for Environment: The Adoption Studies
Even when you remove the “bad neighborhood” variable entirely, the gap remains.
Minnesota Transracial Adoption Study: This landmark study tracked Black, White, and Mixed-race children adopted into the same high-functioning, upper-middle-class White families.
The Result: By age 17, the IQ and performance gaps between the groups reappeared, aligning with the averages of their biological ancestry groups, not their adoptive families. (Scarr & Weinberg, 1992)
Environment could not erase the heritable differences in cognitive ability.
The Bottom Line: The Wealth Gap is a Skills Gap
In a modern economy, income correlates with g (general intelligence).
Research by Neal and Johnson (1996) showed that when you control for basic cognitive skills (AFQT scores), the wage gap between Black and White men virtually disappears.
The wealth gap exists because the distribution of these skills is not identical across populations.
Reparations is an attempt to use financial plumbing to fix a biological and cultural reality. It will fail because you cannot transfer IQ, you cannot transfer impulse control, and you cannot transfer human capital via wire transfer.
The money will simply flow through the hands of those who cannot steward it and return to the hands of those who can, leaving the nation bankrupt and the grievance industry asking for more.
Final Analysis: Reparations Debt to Blacks was Beyond Overpaid
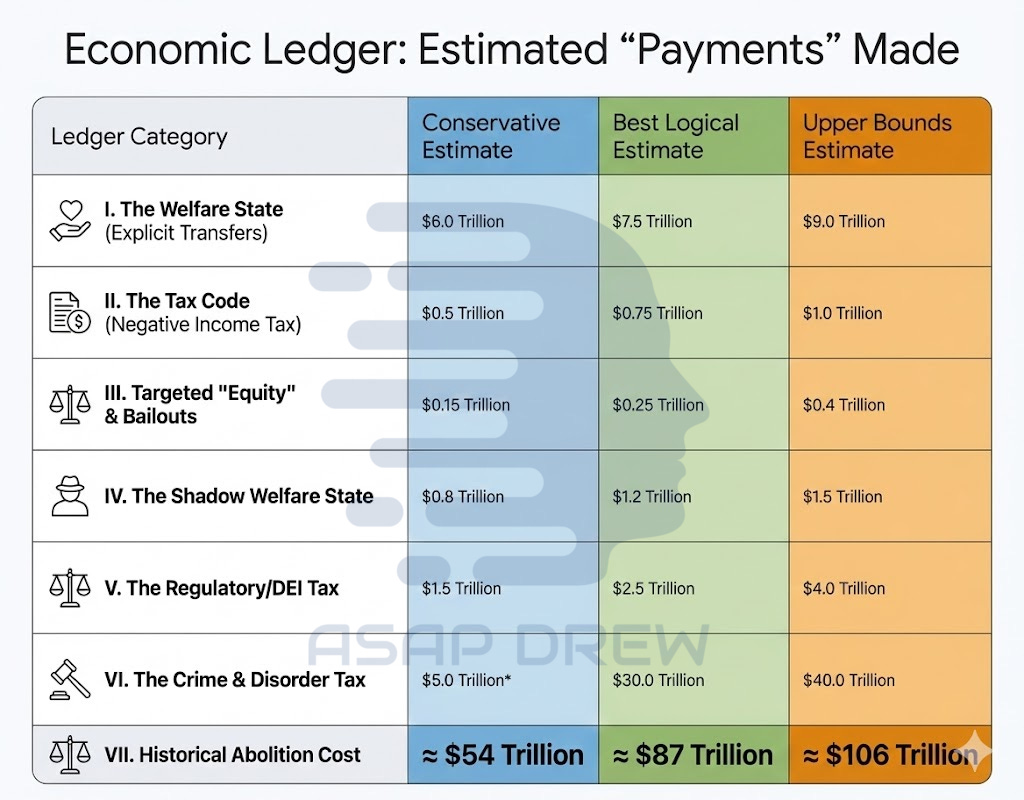
The demand for reparations relies on a selective reading of history and a willful ignorance of modern economics.
It presumes a debt that ignores the blood of the Civil War.
It demands financial compensation while ignoring the $22 trillion already transferred through the welfare state.
It asks for a correction of “systemic racism” while ignoring the efficiency losses and reverse discrimination of Affirmative Action & DEI policies.
When one quantifies the costs of crime (a “net negative” of over a trillion dollars annually), the value of transfer payments (net fiscal beneficiaries), and the investments made in DEI and minority uplift, the conclusion is unavoidable:
The debt has not only been paid, but massively overpaid.
A robust accounting suggests the flow of resources has heavily favored the Black community for decades.
To insist on further payments is not a demand for justice, but a demand for a permanent, race-based subsidy that ignores the realities of the balance sheet.
The pursuit of reparations is a pursuit of a phantom debt, one that threatens to bankrupt the nation (morally and financially) in the chase for a surplus that, by all objective metrics, has long been massively overpaid.
Check the ledger.