
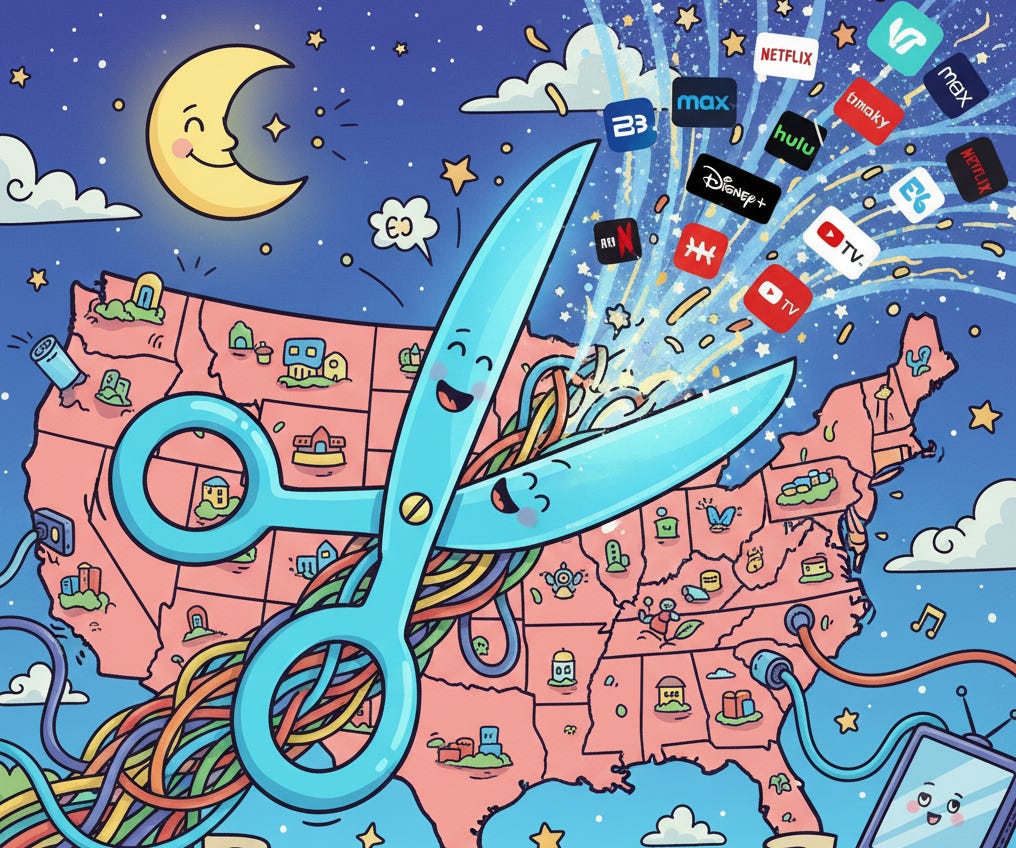
Cable TV Down, Cord Cutting Up: Viewership & Ratings in the Gutter... Woke Politics is Not the Cause
People are just watching other shit... same goes for NBA decline. MLB jump in 2025 is due to big market teams x intriguing matchups.

Cable TV viewership decline in 2025 is primarily due to a combination of:
Cord cutting (MAIN DRIVER)
Attention competition + alternatives (social media, YouTube, Netflix, etc.)
Back in the day (IDK early 2000s) when people weren’t on cell phones… they were typically reading, watching TV, or playing video games (e.g. Nintendo, PlayStation, XBox, etc.).
Now? Too many options… Paradox of Choice. NBA game boring? Matchup lame? The kids end up on Netflix, YouTube, or bingewatching IG/TikTok reels for 10 hours until their retinas are hazed and eyebags parachuting out… sleep deprived from an addictive trance of brain-crack a.k.a. viral short-form vids.
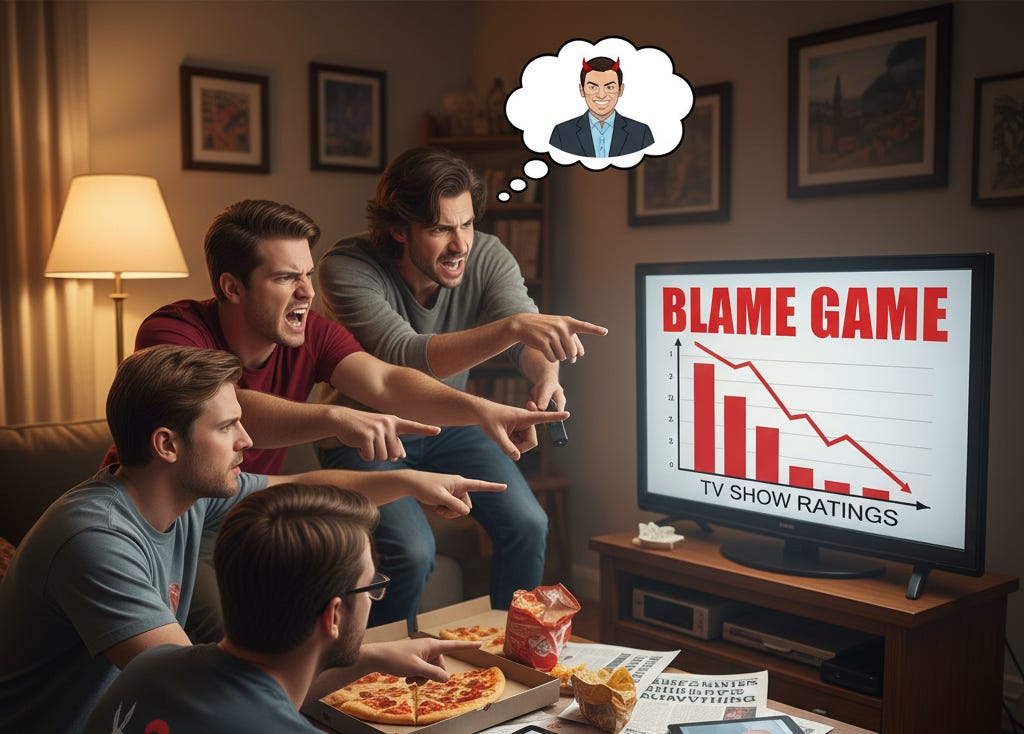
Blaming cable viewership and rating declines on “woke” politics or “too many 3-point shots” (in the case of the NBA) is pure retard juice but very common on social media. Nobody wants to state the primary cause.
I dislike woke infiltration on cable TV (CTV) as much as anyone… but that’s not why Colbert (with the predictably cringeworthy Trump jokes every night) is getting axed from CBS… he’s getting axed because people just watch YouTube instead of Late Night Cable TV… he’s still big on YouTube but the economics don’t work out to maintain the show on CBS.
And no matter what Shaq and Charles say about NBA viewership dropping (it’s because of X-Y-Z: scheduling conflicts, load management of Star players, officiating, small-ball strategies, 3-pointer mania)… implementing their suggested fixes likely won’t do jack shit for stopping the viewership/rating decline freight train.
(I wrote a separate piece “Why NBA Ratings are Down” because I became nauseated with all the speculation from fans, former players, prognosticators (e.g. Stephen A. Smith), current players, right-wingers (“NBA went too woke”)… they are all failing to understand the major driver. Need to get NBA on Netflix/YouTube to get the ratings back up… but not sure how the ROI works.)
I keep repurposing the phrase: Nothing stops this train from Lyn Alden (should be her trademark). Lyn uses it to hammer home the unstoppable momentum of fiscal deficits and government debt expansion — ushering in a paradigm of fiscal dominance; own your hard assets people.
I’ve used it to describe birth rate declines (and noted my prescription for fixing birth rate declines). And now I’m using it again to describe cable TV subscribers declining… and this translates to lower viewership and ratings (year-over-year)… might be some random fluctuations year-to-year… but the trend persists.
Sports games remain popular for a variety of reasons: (1) exciting to watch & popular; (2) live events; (3) gamification, betting, prediction markets (e.g. Fantasy Football, DraftKings, Polymarket)… and with demographics changing rapidly across the U.S. (fewer Whites, more Hispanics) — sports preferences shift.
Some have noted that the MLB Playoffs ratings/views are very high this year… and this wasn’t too surprising to me when thinking about why.
Intriguing stories from smaller markets: Seattle (#2 seed) & Milwaukee (#1 seed). Cal Raleigh / the Average Joes.
Big market teams & cult followings: NY Yankees, Boston Red Sox, Philadelphia Phillies, Chicago Cubs, Detroit Tigers, SD Padres… maybe the Cincy Reds or Cleveland Guardians didn’t matter as much.
Canada is paying attention… Toronto made an appearance… and is in the World Series (as the #1 seed). You have an entire country more intrigued by this because it’s playoffs vs. opening NHL games.
Rule modifications & improvements: Most people like the faster pace play with the pitch clock and new rules implemented to speed the game up slightly relative to a decade ago. These aren’t playing a big role in viewership… but make the games more palatable for many who prefer a 2-4 hour game than a game lasting 4-6.
Stop attributing Cable TV Show Rating/Viewer Declines to Woke Politics

TL;DR: Cable TV’s slide is overwhelmingly structural: cord‑cutting, demographics, cost, fragmentation of rights, and a massive shift of attention to mobile and streaming.
Politics and creative choices matter at the margins, but they are not the main drivers.
If anything, a lot of “declining” brands are thriving off‑linear (e.g., late night on YouTube) while sports spikes (this year’s MLB postseason, women’s basketball, the NFL) are explained by matchups and distribution, not ideology.
Streaming will keep gaining share; linear survives as a niche for live news, local, and tent‑pole sports. (LRG)
Myth vs. reality
Myth: “Show X got too political, and that’s why TV is dying.”
Reality: Pay‑TV peaked around ~100M U.S. subs in 2012 and has fallen steadily since. By end‑2023, the top providers were down to ~71M; S&P says traditional linear penetration fell to ~34% by end‑2024. That long decline predates any recent political cycle and spans nearly every genre.
Myth: “Cable is losing because streaming shows are better.”
Reality: Streaming’s share of TV time keeps rising because distribution changed and the phone became the dominant screen—91% of U.S. adults now own a smartphone; teens are online “almost constantly.” Total TV time is remarkably stable; where that time is spent has shifted. (Pew Research)
Myth: “If the shows changed tone, ratings would snap back.”
Reality: Much of the audience left the bundle entirely. Even people who still follow those shows watch clips on YouTube, Instagram, TikTok, etc.—which can generate bigger audiences than the linear telecast. (EMARKETER)
Myth: “Sports are immune.”
Reality: Sports still over‑index on linear, but rights are fragmenting (Amazon TNF, Sunday Ticket on YouTube TV, Netflix Christmas games, MLB on Peacock/Roku/Apple, MLS on Apple), so reach now depends on where a game lands and who’s playing.
Note #1: Cable TV networks would likely benefit from closely analyzing viewer data/metrics to determine who is watching and what they can do to cater to that specific audience. Who is paying for cable TV? My guess is older people… which is why FoxNews (older people tend to lean conservative/right-wing) is still doing relatively well. They may struggle somewhat if that older generation dies off.
Note #2: Sports aren’t immune to the decline but many find ways to watch because they need to “see their fantasy guys play” or need to watch their DraftKings players or whatever. Sports betting is an epidemic/pandemic in the U.S. right now. I’m all for free markets… but should be better safeguards (e.g. confirm X-amount in bank account or have collateral of a certain amount to prevent people from blowing themselves up). You may have self-control but for some this is like mainlining opioids.
A timeline of the slide (U.S. focus)
2007–2009: Netflix launches streaming (Jan. 2007). Roku ships the first Netflix player (May 2008), putting internet video on the TV. (WIRED)
2012–2013 (the plateau): U.S. pay‑TV households hover ~100M (Kagan/SNL Kagan). By 2013 the industry reports its first net loss—this is the inflection point. (nScreenMedia)
2015–2017 (unbundling begins): “vMVPDs” arrive (Sling TV in 2015; YouTube TV in 2017). Cord‑cutters can keep live channels without a cable box. (Forbes)
2019–2020 (the big streamers): Disney+ launches (Nov. 2019); the pandemic accelerates streaming adoption. (Disney Plus Press)
2021–2025: Nielsen launches The Gauge; streaming’s monthly share rises from ~26% (May 2021) past 40% (2024), and in May 2025 streaming exceeds broadcast + cable combined for the first time. YouTube becomes the #1 “media distributor” by TV time share. (Nielsen)
2022–2025 (sports fragment): Amazon gets exclusive TNF (2022), NFL Sunday Ticket moves to YouTube TV (2023), Netflix adds NFL Christmas games (from 2024). NBA’s next deal (starting 2025‑26) splits across ESPN/ABC, NBC/Peacock, and Amazon. MLB shuffles packages across Peacock → Roku/MLB.tv, Apple’s Friday nights, etc. Fans must chase games across platforms. (ESPN)
2023–2025 (accelerating cord‑cutting): Top providers lose ~5.0M subs in 2023 alone (to ~71.3M). S&P puts traditional linear penetration near one‑third of TV homes by end‑2024. Q1–Q2 2025 data points suggest further erosion even as YouTube TV alone surpasses 8M subs. (LRG)
What’s actually driving the decline (rank‑ordered with rough weights & confidence)
These are directional weights for the long‑run decline in U.S. linear TV viewing since ~2012. They’re not precise econometric coefficients; they combine known measurements with market logic. (High confidence means multiple independent data points align with lived market outcomes.)
Cord‑cutting + distribution shift (35–45%, high confidence). The bundle peaked ~2012; by end‑2023, top providers had 71.3M subs (down from 91.5M in 2018). Traditional penetration is ~34% (end‑2024). Once households leave, linear ratings structurally shrink.
Mobile & short‑form time displacement (20–25%, high confidence). 91% of U.S. adults own smartphones; a large share of teens use YouTube/TikTok daily, with ~16–17% “almost constantly.” That time comes out of legacy TV. (Pew Research Center)
Streaming’s integration into the TV set (12–18%, high confidence). Streaming’s share of TV time rose to ~40%+ by 2024 and ~45% by mid‑2025, with YouTube top among distributors. Same living‑room screen, different pipes. (Nielsen)
Cost pressure (6–10%, medium‑high confidence). Average cable/satellite bills around $120+/mo (unbundled), $188 for “big bundles”; streamers average ~$69 but are rising—so some households downsize everything. (J.D. Power)
Rights fragmentation & access friction (6–10%, medium confidence). NFL packages on Amazon/YouTube/Netflix + MLB on Peacock/Roku/Apple + MLS on Apple → discovery confusion, extra subscriptions, and blackouts that move viewers off linear. (ESPN)
Demographics (5–8%, medium confidence). Median age 39.1 (record); births near 45‑year low; Hispanic share ~19.5% (and rising). Aging + different cultural preferences (language, sports, digital‑first) reshape demand. (Census.gov)
Piracy (2–5%, medium confidence). MUSO tracked ~216B visits to piracy sites in 2024; live‑sports piracy remains significant; big illicit sites draw enormous traffic. That’s not the main driver, but it erodes margins/reach. (HubSpot)
Show‑level creative/politics (≤3%, low‑medium confidence overall). Tone can help or hurt a specific program, but it can’t reverse macro usage shifts. Late night proves the point: linear ratings fell, yet channels rack up huge digital reach. (EMARKETER) (Things like “style of play” in the NBA fit within this driver… almost meaningless.)
Dunking on “political shows” misses the plot
Late‑night linear ratings are down… but those hosts now publish clips where the audience actually lives.
Jimmy Kimmel, Fallon, Colbert, et al. routinely generate digital views that dwarf their nightly linear audience.
Fortune calls YouTube “late night’s second home,” which is where the younger demo watches anyway. Blaming politics confuses format migration with content rejection.
Case study: sports are “up”—but for structural reasons that support the thesis
IMO a lot of this is because people won’t stop watching sports… humans love competitive endeavors. If marketed heavily in the media and the matchup is intriguing and/or high stakes… you’ll attract more eyeballs. Add in the gambling-fantasy-prediction market degens… recipe for face-melting views.
MLB 2025 postseason: Through the Division Series, games averaged 4.33M viewers—the best in 15 years, +30% YoY—thanks to big‑market draws and dramatic matchups. That’s format‑agnostic: the audience followed the stakes across Fox/ESPN/streaming. (FOX Sports)
Women’s basketball: The 2024 NCAA women’s title game averaged ~18.9M, becoming the most‑watched basketball game (any level) since 2019; the WNBA set modern records in 2024 and again in 2025. Those surges track star power and better windows, not politics. (Nielsen)
NFL: Still the biggest tent‑pole. Sunday Night Football averaged 21.6M in 2024 (best since 2015), Prime Video’s TNF hit a record since going exclusive, and early 2025 pace is up. But even here, packages on Amazon/YouTube/Netflix prove the access‑friction point. (NBC Sports)
Bottom line: Spikes occur when matchups + availability line up. Slumps happen when games are scattered behind multiple paywalls or on services cord‑cutters don’t have. That’s distribution and attention competition—not ideology. (Kroll Cases)
The attention marketplace the shows are competing with (and usually losing to)
Streaming now dominates TV time and YouTube is often the top “media distributor” on U.S. televisions. (Nielsen)
Average U.S. adults hold ~4 paid video subscriptions; ad‑tiers are surging (≈46% of subs across majors). (Kantar)
Mobile rules daily media time (≈4 hours/day on mobile), with teens living on YouTube/TikTok/Snap. That’s structural displacement. (EMARKETER)
How low can linear go? A 10/20/50‑year outlook

I had ChatGPT speculate how Cable TV trends project over the next 10 years, 20 years, and 50 years (highly speculative).
Note: “Linear TV” is a term that means traditional TV that you watch on a set schedule (i.e. basically cable, satellite, over-the-air broadcast TV you’re tuning into to watch “live”). It’s called linear because it flows in a linear timeline and everyone watches together.
Assumptions: Sports rights keep shifting to streamers; broadband/CTV penetration keeps rising; ad‑tier economics improve; occasional re‑bundles (streaming “bundles of bundles”) slow, but don’t stop, erosion. Ranges are U.S. households & viewing share.
10 years (2035) — Base case
Linear pay‑TV households: ~20–25M (from ~70M+ in 2018 and ~71M in 2023 including vMVPDs; traditional linear nearer ~35–40M by mid‑2020s).
Linear share of TV time: ~10–15%. Streaming/CTV ≥60%.
Where linear survives: big‑tent sports on broadcast, local news, some reality/game shows, “appointment” political events.
What could change it: a universal sports super‑bundle on CTV (helps reach, still not “linear”), or regulation forcing more marquee events back to broadcast.
20 years (2045) — Base case
Linear households: ~10–15M.
Share of TV time: ~5–10%.
Shape of the market: aggregation wins (few mega‑bundles that mix SVOD + FAST + live sports). ATSC 3.0 makes over‑the‑air broadcast a resilient backstop but niche.
50 years (2075) — Exploratory
Linear households: single‑digit millions—primarily institutional, rural fallback, seniors, and OTA enthusiasts.
Share of TV time: ≤5% most months, spiking only for national emergencies and a handful of mega‑events (e.g., Super Bowl‑equivalents).
Wildcards: immersive formats, AI personalization, rights policy (must‑carry equivalents for streamers), or a major push against piracy.
Confidence notes: 10‑year forecast high; 20‑year medium; 50‑year low—technology/regulation could swing things.
Are any shows or networks bucking the trend?
Sports with compelling stars + easy availability (women’s college hoops 2024; WNBA 2024–25; parts of NFL; MLB 2025 postseason so far) can produce year‑over‑year gains. These are matchup‑ and window‑driven bursts, not broad linear recoveries. (Nielsen)
Digital late night is thriving on YouTube even as linear declines—precisely because the audience moved. (EMARKETER)
YouTube (as a TV app) is the biggest single “TV distributor” by time share today—proof the living room didn’t die; the pipe changed. (Reuters)
Note: I researched FoxNews and they are holding their own. I think views may even be higher or the same as over a decade ago. This is partly because they are really the only reasonable network for right-wing/conservative news on CTV. Also older people tend to have CTV more than other demographics and spend more time watching TV… and they lean conservative… making this somewhat predictable. Curious how FoxNews ratings will be and how they’ll adapt over the next 10-20 years though.
Why people keep blaming politics anyway
Availability bias: High‑profile jokes get screenshots; distribution shifts do not.
Attribution error: Humans over‑credit narrative explanations (“They dunked on X!”) and under‑credit infrastructure (billing, rights, UI, device adoption).
Selective evidence: Viewers who dislike a host imagine “everyone’s tuning out,” even when the same host’s digital clips are top‑charting.
If you present facts over feelings… people almost always react with feelings over facts. As a general rule… feelings always beat facts for persuasion.
However, maybe I’m a bit crazy… but I like to think there remain reasonable people who can temporarily unplug their brains from social media and realize… oh yeah I guess even though I hate some left-wing talk show host… the cancellation is probably a result of cable cutting and ~80% of viewership shifting to YouTube.
And sure you may not like Colbert’s jokes… but he was still crushing it on YouTube.
So the next time you hear about ratings dropping for NBA or Kimmel and Colbert… try to think logically and remember that it might just be because… nothing stops this train of cord/cable cutting.
(If certain CTV shows/networks and sports leagues like the NBA wanted to save themselves… they’d strike up deals with Netflix and YouTube to get as many games aired as possible if the ROI is reasonable. Why? Everyone has Netflix and YouTube… they are the most efficient way to maximize eyeballs.)
I think CTV could somehow offer more selection-type bundles that lure in more customers. Examples I can think of: Pick 10 channels; Pick 15 channels; Pick 20 channels, etc. depending on how many channels you watch - you just pay for the stuff you actually want… but you can switch anytime/any month — but pricing needs to be more competitive… perhaps find ways to axe some of those CTV fees (absurd even if you “bundle” with things like internet).
Will be interesting to see how CTV providers adapt.
So remember… most morons speculating about declines in Cable TV show ratings/views is the blind leading the blind with things they want to be reasons for the declines… not what’s actually driving it.